Download
1 / 18
180 likes | 395 Views
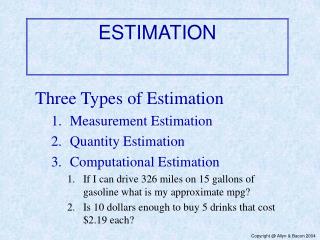
Estimation. Goal: Use sample data to make predictions regarding unknown population parameters Point Estimate - Single value that is best guess of true parameter based on sample Interval Estimate - Range of values that we can be confident contains the true parameter. Point Estimate.

E N D
Estimation • Goal: Use sample data to make predictions regarding unknown population parameters • Point Estimate - Single value that is best guess of true parameter based on sample • Interval Estimate - Range of values that we can be confident contains the true parameter
Point Estimate • Point Estimator - Statistic computed from a sample that predicts the value of the unknown parameter • Unbiased Estimator - A statistic that has a sampling distribution with mean equal to the true parameter • Efficient Estimator - A statistic that has a sampling distribution with smaller standard error than other competing statistics
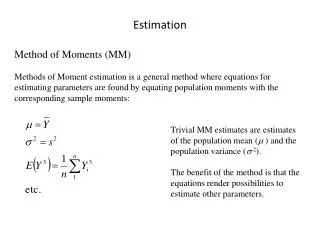
Point Estimators • Sample mean is the most common unbiased estimator for the population mean m • Sample standard deviation is the most common estimator for s (s2 is unbiased for s2) • Sample proportion of individuals with a (nominal) characteristic is estimator for population proportion
Confidence Interval for the Mean • Confidence Interval - Range of values computed from sample information that we can be confident contains the true parameter • Confidence Coefficient - The probability that an interval computed from a sample contains the true unknown parameter (.90,.95,.99 are typical values) • Central Limit Theorem - Sampling distributions of sample mean is approximately normal in large samples
Confidence Interval for the Mean • In large samples, the sample mean is approximately normal with mean m and standard error • Thus, we have the following probability statement: • That is, we can be very confident that the sample mean lies within 1.96 standard errors of the (unknown) population mean
Confidence Interval for the Mean • Problem: The standard error is unknown (s is also a parameter). It is estimated by replacing s with its estimate from the sample data: 95% Confidence Interval for m :
Confidence Interval for the Mean • Most reported confidence intervals are 95% • By increasing confidence coefficient, width of interval must increase • Rule for (1-a)100% confidence interval:
Properties of the CI for a Mean • Confidence level refers to the fraction of time that CI’s would contain the true parameter if many random samples were taken from the same population • The width of a CI increases as the confidence level increases • The width of a CI decreases as the sample size increases • CI provides us a credible set of possible values of m with a small risk of error
Confidence Interval for a Proportion • Population Proportion - Fraction of a population that has a particular characteristic (falling in a category) • Sample Proportion - Fraction of a sample that has a particular characteristic (falling in a category) • Sampling distribution of sample proportion (large samples) is approximately normal
Confidence Interval for a Proportion • Parameter: p (a value between 0 and 1, not 3.14...) • Sample - n items sampled, X is the number that possess the characteristic (fall in the category) • Sample Proportion: • Mean of sampling distribution: p • Standard error (actual and estimated):
Confidence Interval for a Proportion • Criteria for large samples • 0.30 < p < 0.70 n > 30 • Otherwise, X > 10, n-X > 10 • Large Sample (1-a)100% CI for p :
Choosing the Sample Size • Bound on error (aka Margin of error) - For a given confidence level (1-a), we can be this confident that the difference between the sample estimate and the population parameter is less than za/2 standard errors in absolute value • Researchers choose sample sizes such that the bound on error is small enough to provide worthwhile inferences
Choosing the Sample Size • Step 1 - Determine Parameter of interest (Mean or Proportion) • Step 2 - Select an upper bound for the margin of error (B) and a confidence level (1-a) Proportions (can be safe and set p=0.5): Means (need an estimate of s):
Small-sample Inference for m • t Distribution: • Population distribution for a variable is normal • Mean m, Standard Deviation s • The t statistic has a sampling distribution that is called the t distribution with (n-1) degrees of freedom: • Symmetric, bell-shaped around 0 (like standard normal, z distribution) • Indexed by “degrees of freedom”, as they increase the distribution approaches z • Have heavier tails (more probability beyond same values) as z • Table B gives tA where P(t > tA) = A for degrees of freedom 1-29 and various A
Probability Cri t ical Values Degrees of Freedom Critical Values
Small-Sample 95% CI for m • Random sample from a normal population distribution: • t.025,n-1 is the critical value leaving an upper tail area of .025 in the t distribution with n-1 degrees of freedom • For n 30, use z.025 = 1.96 as an approximation for t.025,n-1
Confidence Interval for Median • Population Median - 50th-percentile (Half the population falls above and below median). Not equal to mean if underlying distribution is not symmetric • Procedure • Sample n items • Order them from smallest to largest • Compute the following interval: • Choose the data values with the ranks corresponding to the lower and upper bounds