Download
1 / 56
560 likes | 700 Views
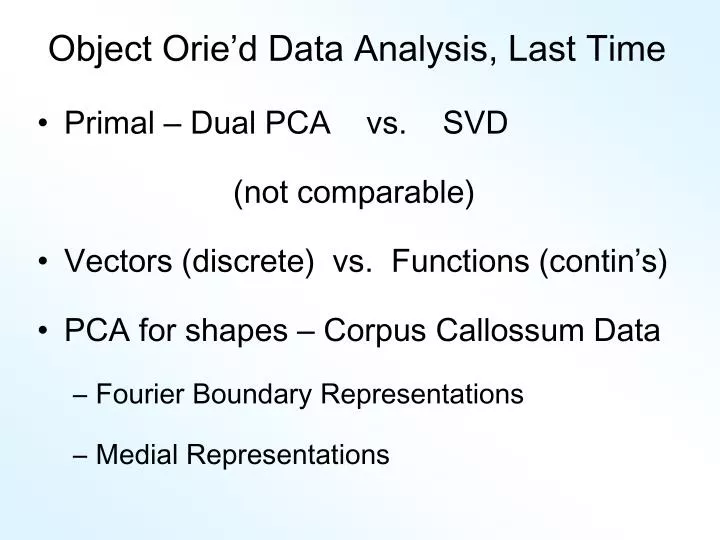
Object Orie’d Data Analysis, Last Time. Primal – Dual PCA vs. SVD (not comparable) Vectors (discrete) vs. Functions (contin ’ s) PCA for shapes – Corpus Callossum Data Fourier Boundary Representations Medial Representations. Cornea Data. Cornea: Outer surface of the eye

E N D
Object Orie’d Data Analysis, Last Time • Primal – Dual PCA vs. SVD (not comparable) • Vectors (discrete) vs. Functions (contin’s) • PCA for shapes – Corpus Callossum Data • Fourier Boundary Representations • Medial Representations
Cornea Data Cornea: Outer surface of the eye Driver of Vision: Curvature of Cornea Sequence of Images Objects: Images on the unit disk Curvature as “Heat Map” Special Thanks to K. L. Cohen, N. Tripoli, UNC Ophthalmology
Cornea Data Cornea Data: Raw Data Modes of Variation?
Cornea Data • Reference: Locantore, et al (1999) Visualization (generally true for images): • More challenging than for curves (since can’t overlay) • Instead view sequence of images • Harder to see “population structure” (than for curves) • So PCA type decomposition of variation is more important
Cornea Data Nature of images (on the unit disk, not usual rectangle) • Color is “curvature” • Along radii of circle (direction with most effect on vision) • Hotter (red, yellow) for “more curvature” • Cooler (blue, green) for “less curvature” • Feature vec. is coeff’s of Zernike expansion • Zernike basis: ~ Fourier basis, on disk • Conveniently represented in polar coord’s
Cornea Data Data Representation - Zernike Basis • Pixels as features is large and wasteful • Natural to find more efficient represent’n • Polar Coordinate Tensor Product of: • Fourier basis (angular) • Special Jacobi (radial, to avoid singularities) • See: • Schwiegerling, Greivenkamp & Miller (1995) • Born & Wolf (1980)
PCA of Cornea Data Recall: PCA can find (often insightful) direction of greatest variability • Main problem: display of result (no overlays for images) • Solution: show movie of “marching along the direction vector” Cornea Data PC1 movie
PCA of Cornea Data PC1 Movie:
PCA of Cornea Data PC1 Summary: • Mean (1st image): mild vert’l astigmatism known pop’n structure called “with the rule” • Main dir’n: “more curved” & “less curved” • Corresponds to first optometric measure (89% of variat’n, in Mean Resid. SS sense) • Also: “stronger astig’m” & “no astig’m” • Found corr’n between astig’m and curv’re • Scores (blue): Apparent Gaussian dist’n
PCA of Cornea Data PC2 Movie: Mean: same as above • Common centerpoint of point cloud • Are studying “directions from mean” Images along direction vector: • Looks terrible??? • Why?
PCA of Cornea Data PC2 Movie:
PCA of Cornea Data PC2 Movie: • Reason made clear in Scores Plot (blue): • Single outlying data object drives PC dir’n • A known problem with PCA • Recall finds direction with “max variation” • In sense of variance • Easily dominated by single large observat’n
PCA of Cornea Data Toy Example: Single Outlier Driving PCA
PCA of Cornea Data PC2 Affected by Outlier: How bad is this problem? View 1: Statistician: Arrggghh!!!! • Outliers are very dangerous • Can give arbitrary and meaningless dir’ns • What does 4% of MR SS mean???
PCA of Cornea Data PC2 Affected by Outlier: How bad is this problem? View 2: Ophthalmologist: No Problem • Driven by “edge effects” (see raw data) • Artifact of “light reflection” data gathering (“eyelid blocking”, and drying effects) • Routinely “visually ignore” those anyway • Found interesting (& well known) dir’n: steeper superior vs steeper inferior
Cornea Data Cornea Data: Raw Data Which one is the outlier? Will say more later …
PCA of Cornea Data PC3 Movie
PCA of Cornea Data PC3 Movie (ophthalmologist’s view): • Edge Effect Outlier is present • But focusing on “central region” shows changing dir’n of astig’m (3% of MR SS) • “with the rule” (vertical) vs. “against the rule” (horizontal) • most astigmatism is “with the rule” • most of rest is “against the rule” (known folklore)
PCA of Cornea Data PC4 movie
PCA of Cornea Data Continue with ophthalmologists view… PC4 movie version: • Other direction of astigmatism??? • Location (i.e. “registration”) effect??? • Harder to interpret … • OK, since only 1.7% of MR SS • Substantially less than for PC2 & PC3
PCA of Cornea Data Ophthalmologists View (cont.) Overall Impressions / Conclusions: • Useful decomposition of population variation • Useful insight into population structure
PCA of Cornea Data Now return to Statistician’s View: • How can we handle these outliers? • Even though not fatal here, can be for other examples… • Recall Simple Toy Example (in 2d):
Outliers in PCA Deeper Toy Example:
Outliers in PCA Deeper Toy Example: • Why is that an outlier? • Never leaves range of other data • But Euclidean distance to others very large relative to other distances • Also major difference in terms of shape • And even smoothness • Important lesson: many directions in
Outliers in PCA Much like earlier Parabolas Example But with 1 “outlier” thrown in
Outliers in PCA PCA for Deeper Toy E.g. Data:
Outliers in PCA Deeper Toy Example: • At first glance, mean and PC1 look similar to no outlier version • PC2 clearly driven completely by outlier • PC2 scores plot (on right) gives clear outlier diagnostic • Outlier does not appear in other directions • Previous PC2, now appears as PC3 • Total Power (upper right plot) now “spread farther”
Outliers in PCA Closer Look at Deeper Toy Example: Mean “influenced” a little, by the outlier • Appearance of “corners” at every other coordinate PC1 substantially “influenced” by the outlier • Clear “wiggles”
Outliers in PCA What can (should?) be done about outliers? • Context 1: Outliers are important aspects of the population • They need to be highlighted in the analysis • Although could separate into subpopulations • Context 2: Outliers are “bad data”, of no interest • recording errors? Other mistakes? • Then should avoid distorted view of PCA
Outliers in PCA Standard Statistical Approaches to Dealing with Outliers: Outlier Deletion: • Kick out“bad data” Robust Statistical methods: • Work with full data set, but downweight“bad data” • Reduce influence, instead of “deleting”
Outliers in PCA Example Cornea Data: • Can find PC2 outlier (by looking through data (careful!)) • Problem: after removal, another point dominates PC2 • Could delete that, but then another appears • After 4th step have eliminated 10% of data (n = 43)
Outliers in PCA Motivates alternate approach: Robust Statistical Methods • Recall main idea: Downweight (instead of delete) outliers a large literature. Good intro’s (from different viewpoints) are: • Huber (1981) • Hampel, et al (1986) • Staudte & Sheather (1990)
Outliers in PCA Simplerobustness concept: breakdown point • how much of data “moved to ” will “destroy estimate”? • Usual mean has breakdown 0 • Median has breakdown ½ (best possible) • Conclude: Median much more robust than mean • Median uses all data • Median gets good breakdown from “equal vote”
Outliers in PCA Mean has breakdown 0 Single Outlier Pulls Mean Outside range of data
Outliers in PCA Controversy: Is median’s “equal vote” scheme good or bad? Huber: Outliers contain some information, • So should only control “influence” (e.g. median) Hampel, et. al.: Outliers contain no useful information • Should be assigned weight 0 (not done by median) • Using “proper robust method” (not simply deleted)
Outliers in PCA Robustness Controversy (cont.): • Both are “right” (depending on context) • Source of major (unfortunately bitter) debate! Application to Cornea data: • Huber’s model more sensible • Already know some useful info in each data point • Thus “median type” methods are sensible
Robust PCA What is multivariate median? • There are several! (“median” generalizes in different ways) • Coordinate-wise median • Often worst • Not rotation invariant (2-d data uniform on “L”) • Can lie on convex hull of data (same example) • Thus poor notion of “center”
Robust PCA • Coordinate-wise median • Not rotation invariant • Thus poor notion of “center”
Robust PCA • Coordinate-wise median • Can lie on convex hull of data • Thus poor notion of “center”
Robust PCA What is multivariate median (cont.)? ii. Simplicial depth (a. k. a. “data depth”): Liu (1990) • “Paint Thickness” of dim “simplices” with corners at data • Nice idea • Good invariance properties • Slow to compute
Robust PCA What is multivariate median (cont.)? iii. Huber’s M-estimate: • Given data , Estimate “center of population” by • Where is the usual Euclidean norm • Here: use only (minimal impact by outliers)
Robust PCA • Huber’s M-estimate (cont): • Estimate “center of population” by • Case : Can show (sample mean) (also called “Frechét Mean”) • Here: use only (minimal impact by outliers)
Robust PCA M-estimate (cont.): A view of minimizer: solution of A useful viewpoint is based on: = “Proj’n of data onto sphere cent’d at with radius ” And representation:
Robust PCA M-estimate (cont.): Thus the solution of is the solution of: So is location where projected data are centered “Slide sphere around until mean (of projected data) is at center”
Robust PCA M-estimate (cont.): “Slide sphere around until mean (of projected data) is at center”
Robust PCA M-estimate (cont.): Additional literature: Called “geometric median” (long before Huber) by: Haldane (1948) Shown unique for by: Milasevic and Ducharme (1987) Useful iterative algorithm: Gower (1974) (see also Sec. 3.2 of Huber). Cornea Data experience: works well for
Robust PCA M-estimate for Cornea Data: Sample Mean M-estimate • Definite improvement • But outliers still have some influence • Improvement? (will suggest one soon)
Robust PCA Now have robust measure of “center”, how about “spread”? I.e. how can we do robust PCA?
Robust PCA Now have robust measure of “center”, how about “spread”? I.e. how can we do robust PCA?
Robust PCA Approaches to Robust PCA: • Robust Estimation of Covariance Matrix • Projection Pursuit • Spherical PCA