Download
1 / 21
210 likes | 366 Views
Ambulatory Surgical Centers Improving Clinical Outcomes and Lowering Cost. Ambulatory Surgical Centers (ASCs). Integral component of U.S. healthcare delivery system 40% of outpatient surgeries performed in ASCs Patient access through over 5,000 facilities in nearly every state

E N D
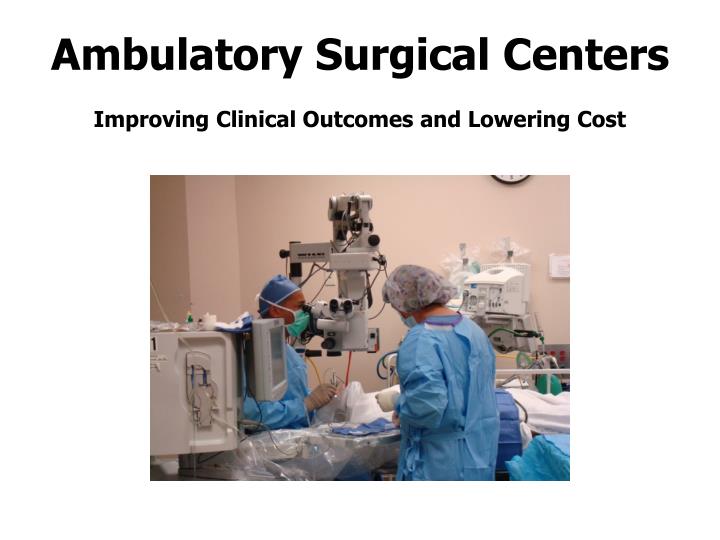
Ambulatory Surgical CentersImproving Clinical Outcomes and Lowering Cost
Ambulatory Surgical Centers (ASCs) • Integral component of U.S. healthcare delivery system • 40% of outpatient surgeries performed in ASCs • Patient access through over 5,000 facilities in nearly every state • High quality care • Superior patient outcomes • Low infection rates • Comprehensive regulatory standards • 92% patient satisfaction • Committed to transparency • Worked with CMS to develop quality measures • Voluntary public reporting of outcomes data at www.ascquality.org • Savings opportunity • 56% savings to beneficiaries; 41% savings to Medicare • Shifting just 50% of outpatient procedures from hospitals to ASCs would save Medicare an additional $2.3 billion Note: Sources appear in detailed footnotes on later slides.
5130 ASCs Across The U.S. 17 224 16 15 21 (NH) 54 60 (MA) 91 77 11 (RI) 56 15 57 45 (CT) 84 19 224 209 (NJ) 25 25 (DE) 198 47 348 (MD) 123 119 52 11 4 (DC) 51 45 103 35 108 64 687 77 148 65 50 64 149 23 258 36 65 73 351 383 9 12 (HI) 25 (PR) Source: September, 2008, Medicare Provider of Service file. 2 (GU)
Many Hospitals Own ASCs • Hospitals have ownership interests in over 1000 ASCs Source: 2008 ASC Association Salary and Benefits Survey.
56% Savings to Beneficiaries Five Highest Volume ASC Procedures Note: Savings based on 2009 national Medicare rates weighted by 2007 Medicare ASC case volume data for top 5 procedures. Copay amounts are national unadjusted rates.
41% Savings to Medicare Avg. = 59% Source: ASC Association Analysis of 2009 Medicare ASC Payment Rates.
Huge Potential Savings Still Available • 57% of outpatient surgeries still performed in hospitals1 • $2.3 Billion savings to Medicare if just half of those surgeries were moved to the ASC setting2 • Reciprocally, if all ASC services were performed in hospitals, Medicare expenditures would increase by $2.0 Billion in 20093 (1) Cullen KA, Hall MJ, Golosinskiy A. Ambulatory Surgery in the United States, 2006. National health statistics reports; no 11. Hyattsville, MD: National Center for Health Statistics. 2009. Only looks at surgeries performed in a facility setting. (2) Based on 2006 Medicare HOPD case volume data and 2009 national Medicare rates. (3) Based on 2006 Medicare ASC case volume data and 2009 national Medicare rates.
Superior Patient Outcomes at ASCs • ASC patients less likely to require unscheduled follow-up care at ER or hospital within 7 days of surgery Risk-adjusted Rates of ER Visit or Hospital Admission Rate Per 100,000 Procedures Source: Fleisher LA, Pasternak LR, Herbert R, Anderson GF. Inpatient hospital admission and death after outpatient surgery in elderly patients: importance of patient and system characteristics and location of care. Arch Surg. 2004 Jan;139(1):67-72.
Low Infection Rates in ASCs • A recent national survey showed more than half of ASCs have infection rates of 0 Percent of ASCs Source: 3rd Qtr 2008 ASC Association Outcomes Monitoring Project.
Comprehensive Regulatory Standards Effective May 18, 2009. Source: 42 CFR 416.
Committed to Quality & Transparency • Industry took initiative to obtain National Quality Forum (NQF) endorsement of facility level clinical quality measures: • Hospital transfer / admission • Wrong site / side / patient / procedure / implant • Falls • Burns • IV antibiotic timing • Surgical site hair removal • Voluntary public reporting of clinical quality data in 2009 through ASC Quality Collaboration • Seeking patient access to side-by-side comparison of ASC and HOPD quality scores on comparable measures
92% Patient Satisfaction Source: Press Ganey Outpatient Pulse Report 2008. Represents the experiences of 1,039,289 patients treated at 1,218 facilities nationwide between January 1 and December 31, 2007.
ASCs Support Public Health Needs • Increase in colonoscopies during last decade is one of very few areas where the Healthy People 2010 goal is being met • Still, 49% of Medicare age population has yet to have the recommended colorectal scope procedures SOURCE: Centers for Disease Control and Prevention, National Center for Health Statistics, National Health Interview Survey. Note: Healthy People 2010, started in January 2000 by the United States Department of Health and Human Services, is a nationwide health promotion and disease prevention plan to be achieved by the year 2010.
Increasing Need for ASC Services • Aging population will require increasing access to services provided by ASCs, such as cataract surgeries Sources: Eye Diseases Prevalence Research Group (Archives of Ophthalmology 2004; 122:487-494) and U.S. Census Bureau, Population Division, Interim State Population Projections, 2005.
Payments Decreasing in GI and Eye Medicare Payment Changes, Five Highest Volume ASC Procedures Note: Based on 2009 national Medicare rates sorted by 2007 Medicare ASC case volume data.
HOPD Payments Are Increasing Faster • Other system elements are driving further gaps between ASC and HOPD payments over time • 6 year payment freeze • Two different inflation factors • Two different wage indices • Application of secondary weighting factor Sources: Historical ASC and OPPS rate info from CMS. OPPS projections based on the historical OPPS relative weight for HCPC 45378 and inflated using CBO’s projected market basket increases for 2010-2013. ASC projected rates apply CBO’s projection of the CPI-U based on application of CMS’ estimated scaling factor from fully implemented payment rates for 2009.
Same Inflation Drivers As Hospitals Sources: Underlying dataset constructed from publicly available 2008 3rd Quarter earnings announcements of major hospital chains and the Foundation for Ambulatory Surgery in America 2007 ASC Financial Benchmarking Survey.
Growth in # of ASCs Slowing Recent Decline in Growth of ASCs Year-on-Year ∆ in # of ASCs (%) Source: September, 2008, Medicare Provider of Service file.
Medicare Needs Efficiency of ASCs • Impeding surgeon shortage will diminish access to clinically necessary procedures Surgeons Per 1,000 People 65 and Older Source: Physician Supply and Demand: Projections to 2020 U.S. Department of Health and Human Services Health Resources and Services Administration Bureau of Health Professions October 2006 and Census.gov.
MedPAC: Increase Payments for ASCs “It is vital that ASCs be paid adequately to ensure that beneficiaries continue to have access to this option.” Source: MedPAC’s March 2009 Report to the Congress: Medicare Payment Policy.
Recommendations • Ensure ASCs continue to generate savings for Medicare program • Tie ASC reimbursement directly to HOPD • Ensure transparency for clinical quality • Implement comparable measures for HOPD and ASC and report side-by-side