Download
1 / 34
610 likes | 1.4k Views
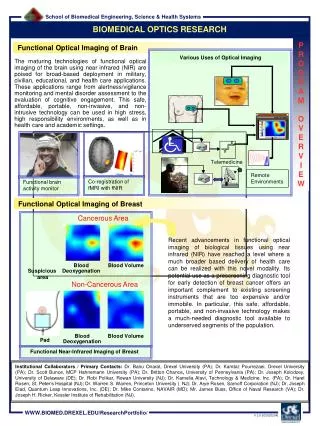
OPTICAL IMAGING. Dido yova Laboratory of biomedical optics and applied biophysics School of electrical and computers engineering National technical university of athens. LABORATORY OF BIOMEDICAL OPTICS AND APPLIED BIOPHYSICS. OPTICAL IMAGING. CONFOCAL LASER SCANNING MICROSCOPY

E N D
OPTICAL IMAGING Dido yova Laboratory of biomedical optics and applied biophysics School of electrical and computers engineering National technical university of athens
LABORATORY OF BIOMEDICAL OPTICS AND APPLIED BIOPHYSICS OPTICAL IMAGING CONFOCAL LASER SCANNING MICROSCOPY IMAGING AT THE CELLULAR LEVEL TISSUE IMAGING AFM AND SHG MICROSCOPY IMAGING OF BIOMOLECULES TISSUE IMAGING 3D BINOCULAR MACHINE VISION SYSTEM FLUORESCENCE MOLECULAR IMAGING
Imaging at the Cellular Level Various imaging technologies are developing to understand and optimize PDT process. New developments in microscopy are providing crucial information and essential approaches for understanding the structure and function of cells and molecules. Combined with: Recent developments in computing and Molecular probes Offer great promise for delivery of vital new information.
IMAGING AT THE CELLULAR LEVELIN PDT The mechanism of tumor destruction by PDT is very complex and is still under investigation. Photoactivation initiates photochemical reactions generating highly cytotoxic reactive oxygen species (ROS) The initial insult is a form of oxidative stress which triggers a variety of events contributing to the inactivation of cancerous cells. A very interesting problem is to image the cascade of events of induced oxidative stress at the cellular level.
Imaging at the Cellular LevelMonitoring early events of cellular response to oxidative stress We investigated the cascade of early intracellular phenomena evoked by oxidative stress in real time at the single cell level. Oxidative stress was induced by photosensitization of ZnPc in Human Fibroblasts using the 647 nm laser line, using a dose that did not lead to apoptosis or necrosis. By : • Confocal Laser Scanning Microscopy • Vital Fluorescent Probes • Photosensitive Molecules • Advanced Image Analysis and Processing
Fibroblasts coincubated with ZnPc and MitoTracker Green.Fluorescence image of ZnPc λexc:647nm, λem:680 nm Fibroblast incubated with MitoTracker Green λexc:488nm, λem:522 nm Merged image of the red and green fluorescence. By advanced colocalization algorithm, ZnPc is above 85% localized in the mitochondria.
Detection of intracellular ROS (Reactive Oxygen Species) generated by ZnPc photosensitization using H2DCFDA. Fibroblasts incubated with ZnPc +H2DCFDA (after oxidation by ROS produces DCF) Pseudocolored image
0 min 30 s 1 min 3 min 8 min 15 min Mitochondrial membrane potential (ΔΨm)decrease after ZnPc photosensitization + JC-1. Resting ΔΨm=140mV ΔΨm =905 mV after oxidative stress
0 min 30 s 2 min 3 min 5 min 10 min Intracellular pH changes after ZnPc photosensitization using the membrane permeable (BCECF-AM) probe . Resting pHi = 7.45 0.03 ΔpHi=0.40 0.08 after oxidative stress
0 min 30 s 1 min 2 min 4 min 30 s 1 min 2 min Spatiotemporal global Ca2+ oscillations evoked by ZnPcphotosensitization monitored by Fluo-3 (pseudocolored images). Time course experiment of intracellular Ca2+concentration. Resting [Ca2+ ] 60nM [Ca2+ ] 0.25μM after oxidative stress
TISSUE OPTICAL IMAGING Development of animal models. Research related to small animals optical imaging
NMSC ANIMAL MODEL Non-melanoma carcinomas in SKH-1 mice
Typical series of confocal images obtained horizontally, at 0, 20, 40 and 60 μm from skin surface, of a healthy hairless mouse 1 hour after topical application of AlClPc. Images were acquired with excitation at 647 nm and emission at 680 nm.
Penetration depth 1490 μm Confocal image obtained from a cross-section of a non-melanoma skin carcinoma topically applied with AlClPc for 1 hour. Images were acquired with excitation at 647 nm and emission at 680nm. The yellow line indicates the penetration depth. Scale bar: 100 μm.
PDT in DERMATOLOGY OPTICAL IMAGING MONITORING Answers to be given: • Accurately imaging tumors smaller than 1 cm. • As PDT is a repeatable technique to monitor tumour shrinkage, after each PDT treatment, will facilitate the optimization of therapy.
3-D Binocular Machine Vision System for Gauging Small Tumors
Tumour area Normal area Animal model for NMSC
3-D Binocular Machine Vision System for Gauging Small Tumors
3-D Binocular Machine Vision System for Gauging Small Tumors • Successful reconstruction and gauging of tumours smaller than 1 cm maximum diameter via a fully automated software package. • Surface rendering and gauging tool for skin tumours imaging and following of their shrinkage after PDT treatment. • Prospects of other medical applications like in burn depth estimation, by introducing an articulated arm. • Useful in a variety of other 3-D gauging applications like in archeology.
FLUORESCENCE MOLECULAR IMAGINGin PDT Non-invasive monitoring of molecular targets is particularly relevant to photodynamic therapy (PDT), including the delivery of photosensitizer in the treatment site and monitoring of molecular and physiological changes following treatment. WHAT ABOUT DEEP SEATED TUMORS?
PROSTATE CANCER ANIMAL MODEL Palpable tumors appear 2 weeks after inoculation. Once they are formed, they grow rapidly. Tumors reach the appropriate size (thickness 4 – 6 mm) approximately 3 – 5 weeks after the inoculation. Animals survive up to 100 days after injection. Tumors 9 weeks post inoculation
FLUORESCENCE MOLECULAR IMAGING One of the most challenging problems in medical imaging is to see a tumour embedded in tissue which is a diffusive medium. • Light in the range of ~650 nm – ~950 nm can penetrate up to several centimeters into tissue because of the low photon absorption in this region of the spectrum, enabling imaging at greater depths. • Tissue autofluorescence is very low in this spectral region as well. However, these photons are highly scattered into tissue and become diffuse.
FLUORESCENCE MOLECULAR IMAGING Progress has been enabled by: • The development of new probes that emit at the near IR region and they have increased photostability and selectivity. • Development of new imaging modalities.
Fluorescence Molecular ImagingPROSTATE CANCER In our Laboratory we use: • Fluorescence probes for labeling prostate tumours at: λexc = 680nm λem = 700nm • Free-space, non-contact geometry for excitation (red diode laser) and detection of light • Direction of excitation and detection from the same side of the tissue
Inverse Problem Forward problem: image x data y. Inverse problem: data y image x. The inverse problem is ill-posed because the solution is non-unique and does not depend continuously on the data.
FORWARD SOLVER • Discretization scheme • Use of the Delaunay Triangulation Method. • Construction of Triangulation Matrix. • Fluorophore distribution mapping • Use of the Super-Ellipsoid Models. • Mapping of the absorption coefficient based on interior/exterior position determination relative to the Super-Ellipsoid surface. • Finite Elements • Application of the Galerking Finite Element Method. • Definition of the Spatial and Angular distribution basis functions.
INVERSE SOLVER • Data fitting process • Intensity adjustment. • Simulated and acquired image coordinates correlation. • Feature extraction. • Image registration. • Image fine-tuning process • Least squares method. • Levenberg-Marquardt optimization. • Database update.
DA • 3072 elements • 8 sec • RTE • 3072 elements • 8 directions • 1.5 h • Coupled RTE-DA • 3072 elements • 8 directions • 24 min This configuration was chosen to match the corresponding properties of Indocyanine Green (ICG) dye. The absorption and isotropic scattering properties of 1% Liposyn solution were chosen to mimic the background of the phantom. The excitation source had been simulated as a point source (Dirac function).
Fluorescence Molecular Imaging The three figures represent the photon density magnitude of the excitation light (top row, marked as a) and the emission light (bottom row, marked as b) at the y = 0 plane. The outcomes are from 3D experiments. The least squares relative residual was in the order of 10-14 for both DA and RTE and in the order of 10-13 for the coupled model.
Inverse Problem Solution The data fitting procedure provides the initial fluorophore distribution. Input Intensity adjustment Denoising Segmentation