Download
1 / 27
270 likes | 493 Views
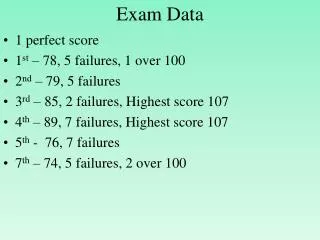
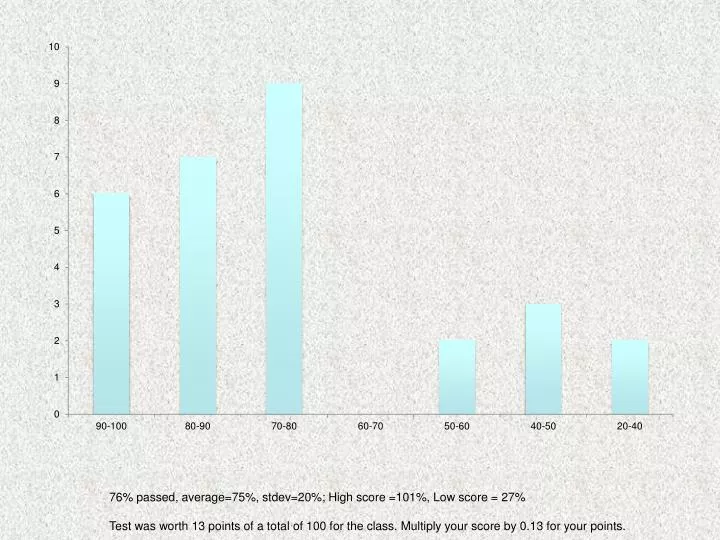
76% passed, average=75%, stdev=20%; High score =101%, Low score = 27% Test was worth 13 points of a total of 100 for the class. Multiply your score by 0.13 for your points. Methods For Studying Microbial Communities. CSS 360 Soil Biology 10 Oct 2011. GREAT PLATE ANOMALY.

E N D
76% passed, average=75%, stdev=20%; High score =101%, Low score = 27% Test was worth 13 points of a total of 100 for the class. Multiply your score by 0.13 for your points.
Methods For Studying Microbial Communities CSS 360 Soil Biology 10 Oct 2011
GREAT PLATE ANOMALY Molecular methods to characterize the soil microbial community have given us insight into the previously unimagined diversity of soil organisms. These methods alone, however, don’t tell us about the function of the soil micro-organisms and should be carried out in conjunction with methods that do. DNA: deoxyribonucleic acids RNA: ribonucleic acids Genetic material sequenced after amplification using PCR (polymerase chain reaction) or used in finger-printing approaches One study found that 6,000-10,000 unique genomes found in soil, compared to 40 cultured organisms
PCR-Based Assays • Technique which is used to amplify the number of copies of a specific region of DNA, in order to produce enough DNA to be adequately tested. • In order to use PCR, one must already know the exact sequences which flank (lie on either side of) both ends of a given region of interest in DNA (may be a gene or any sequence). One need not know the DNA sequence in-between.
PCR-Based Assays TTAACGGGGCCCTTTAAA................................TTTAAACCCGGGTTT Target sequence If these sequences flank (are on either side) of a particular region of a particular organism's DNA, and NO OTHER ORGANISM'S DNA (or a different size product). This region would be a target sequence for PCR. The first step for PCR would be to synthesize "primers" that will be exactly the same as the flanking sequences shown above. We make ONE primer exactly like the forward sequence, this is our forward primer, and we make the reverse the reverse complement of the end sequence TTAACGGGGCCCTTTAAA........TTTAAACCCGGGTTT FWD PRIMER REV PRIMER TTAACGGGGCCCTTTAAA AAACCCGGGTTTAAA The reverse primer is the reverse complement of the end of the gene sequence
Taq Polymerase Isolated from a THERMOPHILIC bacterium in 1965 This allows high temperatures for DNA denaturation $2.3 billion in royalties Nobel prize Does introduce errors 1 in ~10,000 bases
Traditional Approaches Abundance-ID PLFA-Richness ID of those that can be cultured Bacterial richness Certain FA identify certain organisms
Traditional Approaches Microbial Biomass: Chloroform Fumigation Incubation (CFI) and Extraction Methods CFI: exposes soil to ethanol-free chloroform for 24 h to kill indigenous microbes Chloroform is removed and the flush of mineralized CO2 and NH4+ are measured during a 10 d incubation. What causes this flush? The use of cell lysates as a C and energy source by organisms that have survived the fumigation (spores or cysts) Biomass C= (FC-UfC)/KC Biomass C= amount of C trapped in the microbial biomass FC is the CO2 produced by fumigated soil UfC is the CO2 produced by the nonfumigated soil sample KC is the fraction of microbial biomass C mineralized to CO2 *( a constant of 40-45%)
Taxonomy / Function Fluorescence In-Situ Hybridization STARFISH Microautoradiography with whole cell FISH. Radioactive compounds such as acetate, ammonium, glucose, etc. ID AND function Tagged DNA probe complementary to target sequence. ID or function
Taxonomy / Function Stable Isotope Probing (SIP)
Nucleic Acid Analysis Microarrays RFLP Function – Genes turned on or off No direct taxonomy yet >15,000 genes on a chip Use soil DNA (presence) or reverse-transcribed RNA (expression) Dependent on sequences in database Largely outdated Cheap Rough scale taxonomy 16S rRNA gene
DNA sequencing Cloning
DNA sequencing Cloning Limitations of Cloning: Expensive Time consuming PCR your gene of interest Purify your gene of interest Clone your gene Let colonies grow Pick colonies Re-grow picked colonies Submit for sequencing Total time ~ 1 week Cost ~ $1,000 for 96 sequences not including labor (~$14/read)
DNA sequencing High Throughput Sequencing - Pyrosequencing
DNA sequencing High Throughput Sequencing - Pyrosequencing Pyrosequencing (aka 454) Advantages: Lower cost (~$6,000 per 800,000 sequences) (1.3 reads/ 1 cent) Good read length (~600 bases) Disadvantages: PCR can be problematic Errors --- how to deal with that in taxonomy Many steps that are prone to error
DNA sequencing Ilumina Sequencing
DNA sequencing High Throughput Sequencing - Illumina Pyrosequencing (aka 454) Advantages: Lower cost (~$12,000 per 160 million sequences) (133 reads /1 cent) Good read length (~600 bases) Disadvantages: PCR can be problematic Errors --- how to deal with that in taxonomy Many steps that are prone to error
Metagenomics and Metatranscriptomics Mg: Collection of all genes in a sample: Who and what they can do Mt: Collection of all mRNAs in a sample: Who and what they are doing
Gene Quantification Quantitative PCR (q-PCR) Quantitative Reverse Transcription PCR (RT-PCR) Community Fingerprinting T-RFLP DGGE Used less often now T-RFLP like RFLP one end labeled w/dye peaks are size of population Denaturing gradient gel electrophoresis Cut DNA Melts at different conditions Get a gel pattern Changes in diversity Increase in fluorescence over time Standard curve of known gene copies DNA: How many are there? RNA: What is the real expression of the gene?
q-PCR QUANTITATIVE PCR Ability to count the number of target genes Uses a dye that binds to dsDNA Same as PCR Camera records increase in fluorescence due to dye binding over time Can target DNA RNA that is reverse-transcribed Reverse transcription Take ssRNA and convert to dsDNA Why? RNA is degraded rapidly Gives us the ACTIVITY of the gene, not just presence Relate these genes to soil processes, such as N or C cycling
KNOW: Process of PCR, why is it used? Classical methods: Chloroform, Plating, PLFA Taxonomy/Function: FISH, STARFISH, SIP Nucleic Acid Analysis: Microarrays, RFLP, Sequencing Metagenomics vs. Metatranscriptomics Cloning vs. New Methods Quantification: qPCR Broad understanding: Not details!---except for PCR Which method would be used for…… Difference between two methods…..in terms of question answered Knowing more about a method….good bonus question.
Reading Assignment • Bardgett 64-69: Phosphorus Cycling • Bardgett Chapter 4 pp. 86-107(next two lectures)