Download
1 / 10
500 likes | 1.76k Views
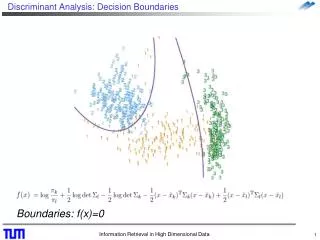
Linear Discriminant Analysis (LDA). Goal . To classify observations into 2 or more groups based on k discriminant functions (Dependent variable Y is categorical with k classes.) Assumptions Multivariate Normal Distribution variables are distributed normally within the classes/groups.

E N D
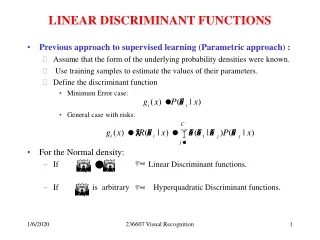
Goal • To classify observations into 2 or more groups based on k discriminant functions (Dependent variable Y is categorical with k classes.) • Assumptions • Multivariate Normal Distribution variables are distributed normally within the classes/groups. • Similar Group Covariances Correlations between and the variances within each group should be similar.
Dependent Variable • Must be categorical with 2 or more classes (groups). • If there are only 2 classes, the discriminant analysis procedure will give the same result as the multiple regression procedure.
Independent Variables • Continuous or categorical independent variables • If categorical, they are converted into binary (dummy) variables as in multiple linear regression
Output Example: Assume 3 classes (y=1,2,3) of the dependent.
Binary Dependent - Regression If only 2 classes of dependent, can do multiple regression Sample data shown below:
Classification Classification Rule in this case: If Pred. Y > 0.5 then Class = 1; else Class = 0. This model yielded 2 misclassifications out of 24. How good is R-square?
Crosstab of Pred. Y and Y For large datasets, one can format the Predicted Y variable and create a crosstab with Y to see how accurately the model classifies the data (fictitious results shown here). The Good and Bad columns represent the number of actual Y values.
Kolmogorov-Smirnov Test Use the crosstabs shown in last slide to conduct the KS Test to determine • Cutoff score, • Classification accuracy, and • Forecasts of model performance.