Download
1 / 25
250 likes | 378 Views
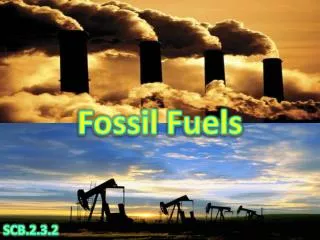
Finite Fossil Fuels and Global Warming. Dr. Robert Brecha Physics Dept., Univ. of Dayton Dayton, OH USA 45469-2314 brecha@udayton.edu. Peak Oil Chautauqua Course University of Dayton May 24-26, 2007. US production peak. Approximately 30 out of 40 largest producers have crossed a peak.

E N D
Finite Fossil Fuels and Global Warming Dr. Robert Brecha Physics Dept., Univ. of Dayton Dayton, OH USA 45469-2314 brecha@udayton.edu Peak Oil Chautauqua Course University of Dayton May 24-26, 2007
US production peak Approximately 30 out of 40 largest producers have crossed a peak
Price Stuart Staniford, http://theoildrum.com
Other Fossil Fuels? - Natural Gas National Petroleum Council (1998) US Prod. Import from Canada 1998 19 Tcf 3.0 Tcf 2005 22.6 Tcf 3.7 Tcf 2010 25.1 Tcf 3.8 Tcf 2015 26.6 Tcf 4.3 Tcf Now the numbers are more like … 1998 19.0 Tcf 2001 19.6 Tcf 2003 19.1 Tcf 2004 18.7 Tcf Canada produced 6.6 Tcf in 2002 and is flat or decreasing slowly, with increasing domestic demand. “Natural Gas: Meeting the Challenge of the Nation’s Growing Natural Gas Demand” National Petroleum Council 1999 http://www.npc.org
Natural Gas in the US (per day) EIA Statistical Review of World Energy data
Reserves/Production for Coal (years left) • In the U.S. • 1939, best estimate: 3800 years • 1953, best estimate: 1900 years • 1993, best estimate: 300 years • 2005, best estimate: 244 years World reserves (BP estimates): 1993 - 250 years 2005 – 155 years 3% growth – 65 years
Non-conventional Fuels • Tar sands – Alberta. • Large resource, low production rate (5 MMb/d in 25 yrs) • Low net energy • High cost ($25 - $50 /bbl) • Shale oil – Wyoming • Large resource, low production rate (1 MMb/d in 20 yrs) • Low net energy • High cost ($75 /bbl) • Corn ethanol • Low net energy • Food vs. fuel • Little greenhouse gas emission gain Rand Corp. report for US DOE, Nat’l. Energy Tech. Lab.; D.Pimentel and T. Patzek, Natural Resources Research 14, 65-76 (2005) Shapouri - USDA “The Energy Balance of Corn Ethanol: An Update” Ag. Econ. Report 813; Farrell et al., Science 311, 506-508 (2006)
Energy Balance “Earth’s Energy Imbalance: Confirmation and Implications” James Hansen, et al. Science 3 June 2005 308: 1431-1435 – Current imbalance of 0.85±0.15 W/m2
Petit et al, Nature v.399 (6735), pp. 429-436. (1999) CO2 range in 2100 Homo erectus Homo neandertalensis CO2 today today Homo sapiens sapiens Homo heidelbergensis
Emissions Scenarios for the Future http://www.ipcc.ch
Scenario GHG Projections http://www.ipcc.ch
Natural Gas and CO2 BP + 50% BP world reserves estimate
a b 500 ppm 2.5°C 2050 2100 2200 2200 2050 2100 Magicc output http://www.cgd.ucar.edu/cas/wigley/magicc/index.html
Global Sea Level Changes S. Rahmstorf, Science 315, 368-370(2007)
Emissions The Energy Journal – Special Issue ICMP (2006)
Fossil energy Renewable energy Energy use
Economic Impact (2x CO2) The Energy Journal – Special Issue ICMP (2006)