Download
1 / 1
10 likes | 95 Views
Interpretation of low latitudinal meteor radar observations at Learmonth, Rarotonga and Cachoeira as migrating and nonmigrating diurnal tides and their comparison with general circulation model results

E N D
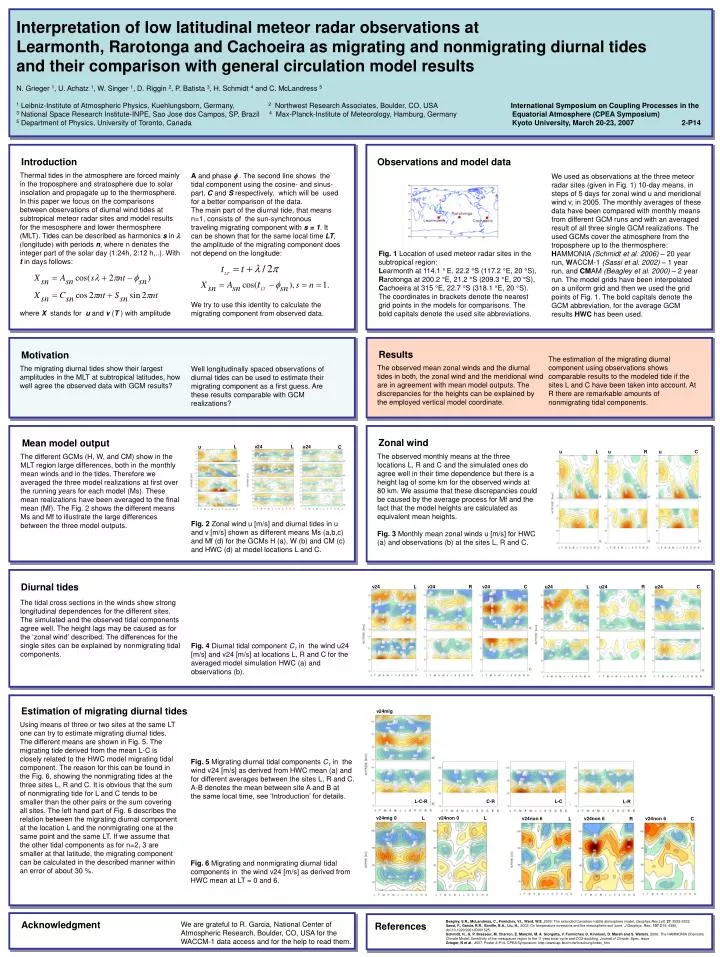
Interpretation of low latitudinal meteor radar observations at Learmonth, Rarotonga and Cachoeira as migrating and nonmigrating diurnal tides and their comparison with general circulation model results N. Grieger 1, U. Achatz 1, W. Singer 1, D. Riggin 2, P. Batista 3, H. Schmidt 4 and C. McLandress 5 1 Leibniz-Institute of Atmospheric Physics, Kuehlungsborn, Germany, 2 Northwest Research Associates, Boulder, CO, USA International Symposium on Coupling Processes in the 3 National Space Research Institute-INPE, Sao Jose dos Campos, SP, Brazil 4 Max-Planck-Institute of Meteorology, Hamburg, Germany Equatorial Atmosphere (CPEA Symposium) 5 Department of Physics, University of Toronto, Canada Kyoto University, March 20-23, 2007 2-P14 Introduction Observations and model data Thermal tides in the atmosphere are forced mainly in the troposphere and stratosphere due to solar insolation and propagate up to the thermosphere. In this paper we focus on the comparisons between observations of diurnal wind tides at subtropical meteor radar sites and model results for the mesosphere and lower thermosphere (MLT). Tides can be described as harmonics s inl (longitude) with periods n, where n denotes the integer part of the solar day (1:24h, 2:12 h,..). With t in days follows: where X stands for u and v (T ) with amplitude A and phase f . The second line shows the tidal component using the cosine- and sinus-part, C and S respectively, which will be used for a better comparison of the data. The main part of the diurnal tide, that means n=1, consists of the sun-synchronous traveling migrating component with s = 1. It can be shown that for the same local time LT, the amplitude of the migrating component does not depend on the longitude: We try to use this identity to calculate the migrating component from observed data. We used as observations at the three meteor radar sites (given in Fig. 1) 10-day means, in steps of 5 days for zonal wind u and meridional wind v, in 2005. The monthly averages of these data have been compared with monthly means from different GCM runs and with an averaged result of all three single GCM realizations. The used GCMs cover the atmosphere from the troposphere up to the thermosphere: HAMMONIA (Schmidt et al. 2006) – 20 year run, WACCM-1 (Sassi et al. 2002) – 1 year run, and CMAM (Beagley et al. 2000) – 2 year run. The model grids have been interpolated on a uniform grid and then we used the grid points of Fig. 1. The bold capitals denote the GCM abbreviation, for the average GCM results HWC has been used. Fig. 1 Location of used meteor radar sites in the subtropical region: Learmonth at 114.1 °E, 22.2 °S (117.2 °E, 20 °S), Rarotonga at 200.2 °E, 21.2 °S (209.3 °E, 20 °S), Cachoeira at 315 °E, 22.7 °S (318.1 °E, 20 °S). The coordinates in brackets denote the nearest grid points in the models for comparisons. The bold capitals denote the used site abbreviations. L-C-R Results Motivation The estimation of the migrating diurnal component using observations shows comparable results to the modeled tide if the sites L and C have been taken into account. At R there are remarkable amounts of nonmigrating tidal components. The observed mean zonal winds and the diurnal tides in both, the zonal wind and the meridional wind are in agreement with mean model outputs. The discrepancies for the heights can be explained by the employed vertical model coordinate. The migrating diurnal tides show their largest amplitudes in the MLT at subtropical latitudes, how well agree the observed data with GCM results? Well longitudinally spaced observations of diurnal tides can be used to estimate their migrating component as a first guess. Are these results comparable with GCM realizations? L v24 L u24 u C Zonal wind u L u R u C Mean model output The observed monthly means at the three locations L, R and C and the simulated ones do agree well in their time dependence but there is a height lag of some km for the observed winds at 80 km. We assume that these discrepancies could be caused by the average process for Mf and the fact that the model heights are calculated as equivalent mean heights. Fig. 3 Monthly mean zonal winds u [m/s] for HWC (a) and observations (b) at the sites L, R and C. The different GCMs (H, W, and CM) show in the MLT region large differences, both in the monthly mean winds and in the tides. Therefore we averaged the three model realizations at first over the running years for each model (Ms). These mean realizations have been averaged to the final mean (Mf). The Fig. 2 shows the different means Ms and Mf to illustrate the large differences between the three model outputs. Fig. 2 Zonal wind u [m/s] and diurnal tides in u and v [m/s] shown as different means Ms (a,b,c) and Mf (d) for the GCMs H (a), W (b) and CM (c) and HWC (d) at model locations L and C. Diurnal tides v24 L v24 R v24 C u24 L u24 R u24 C The tidal cross sections in the winds show strong longitudinal dependences for the different sites. The simulated and the observed tidal components agree well. The height lags may be caused as for the ‘zonal wind’ described. The differences for the single sites can be explained by nonmigrating tidal components. Fig. 4 Diurnal tidal component C1 in the wind u24 [m/s] and v24 [m/s] at locations L, R and C for the averaged model simulation HWC (a) and observations (b). Estimation of migrating diurnal tides v24mig Using means of three or two sites at the same LT one can try to estimate migrating diurnal tides. The different means are shown in Fig. 5. The migrating tide derived from the mean L-C is closely related to the HWC model migrating tidal component. The reason for this can be found in the Fig. 6, showing the nonmigrating tides at the three sites L, R and C. It is obvious that the sum of nonmigrating tide for L and C tends to be smaller than the other pairs or the sum covering all sites. The left hand part of Fig. 6 describes the relation between the migrating diurnal component at the location L and the nonmigrating one at the same point and the same LT. If we assume that the other tidal components as for n=2, 3 are smaller at that latitude, the migrating component can be calculated in the described manner within an error of about 30 %. Fig. 5 Migrating diurnal tidal components C1 in the wind v24 [m/s] as derived from HWC mean (a) and for different averages between the sites L, R and C. A-B denotes the mean between site A and B at the same local time, see ‘Introduction’ for details. L-C C-R L-R v24mig 0 v24non 0 L L v24non 6 v24non 6 v24non 6 L R C Fig. 6 Migrating and nonmigrating diurnal tidal components in the wind v24 [m/s] as derived from HWC mean at LT = 0 and 6. Acknowledgment We are grateful to R. Garcia, National Center of Atmospheric Research, Boulder, CO, USA for the WACCM-1 data access and for the help to read them. Beagley, S.R., McLandress, C., Fomichev, V.I., Ward, W.E.,2000: The extended Canadian middle atmosphere model. Geophys.Res.Lett. 27. 2529-2532. Sassi, F., Garcia, R.R., Boville, B.A., Liu, H., 2002: On temperature inversions and the mesospheric surf zone. J.Geophys. Res., 107,D19, 4380, doi:10.1029/2001JD001525. Schmidt, H., G. P. Brasseur, M. Charron, E. Manzini, M. A. Giorgetta, V. Formichev, D. Kinnison, D. Marsh and S. Walters, 2006:The HAMMONIA Chemistry Climate Model: Sensitivity of the mesopause region to the 11-year solar cycle and CO2-doubling. Journal of Climate, Spec. Issue Grieger, N et al., 2007, Poster 2-P14, CPEA Symposium: http://www.iap-kborn.de/forschung/index_htm References