Download
1 / 19
190 likes | 301 Views
Climate Futures for Tasmania: Prospects, Impacts and Information for Adaption Options Nathan Bindoff et al. ACE CRC, DPIW, Hydro Tasmania,SES,BoM, GA, TIAR, TPAC, CSIRO MAR. Projections of Future Changes in Climate.

E N D
Climate Futures for Tasmania: Prospects, Impacts and Information for Adaption Options Nathan Bindoff et al. ACE CRC, DPIW, Hydro Tasmania,SES,BoM, GA, TIAR, TPAC, CSIRO MAR
Projections of Future Changes in Climate Best estimate for low scenario (B1) is1.8°C (likely range is 1.1°C to 2.9°C),and for high scenario (A1FI) is4.0°C (likely range is 2.4°C to 6.4°C). Broadly consistent with span quoted for SRES in TAR, but not directly comparable
Research Modules • Research activities • Fine scale climate projections • Modelling water flows and reservoirs • Key climate variables • Planning, agriculture, • utility sectors and environment • Extreme events • Changes in occurrence • Consequence of change • Eg drought, flood, frosts, heat waves • Storms/winds
Tasmania Water Catchment Models AWBM Assumption: no change in land use Assumption: no change in land use
Example: Hydro Tasmania Inflow Prediction Most important lake • Factor of 1.0 represents no change in inflows • Factors <1.0 represents drying • Factors >1.0 represents wetter • Great Lake factors well below 1.0 and thus drying predicted • Others have drier Summers/Autumns and wetter Winters
Key Outputs • Outputs/Products • General Climate Impacts • Assessments of climate conditions through 2100 • Mean trends in key variables • Changes in climate variables (winds, heat waves, rainfall) • Reports • General Agricultural Impacts • Assessments of impacts of climate on key agricultural sectors through 2100 • Changes in frost and their impacts • Crop models and disease models, and impacts of climate change • Strategies for adaptation (economic modeling) • Reports to the wider community. • Extreme Events
Key Outputs • Outputs/Products • Extreme Events (on land, and on sea-level) • Risk of winds on infrastructure (eg residential, commercial and industrial) • Assessments of storm surges and sea-level on extreme sea level returns for Tasmania through 2100 • Strategies for adaption • Reports • Water and Water Catcements • Assessments of impacts on water and water catchments through 2100 • Hydro Tasmania, dam and reservoir capacity (and hence yields) • DPIW and Hydro Tasmania stream flow and water availability • SES, provide data for updating flood and flood inundation maps • Strategies for adaption • Reports
Perceived unfunded gaps • Bushfires (Bushfire CRC/GA are interested) • Landslip and soils (depends on extreme rainfall) • Impacts and risks of heat waves, flooding on built assets • Risks for power generation • Risks for natural environment • Risks for forests • Risks for river and catchment chemistry • Economics aspects in this framework.
Introduction • The Players • Key user questions • Research Activities • Downscaling and global signals • Tasmanian context • Research outcome and outputs • Resources
Key User Questions:Climate Change • Water policy and legislation • Water management and infrastructure • Power Generation • Reservoirs, winds • Power Distribution (heat waves) • Emergency planning • Bushfires, floods • Protection of high value assets • From tourism • Impacts on power and water • dependent industry • Agriculture • Crops, wine, other horticulture, disease • Sea level surges • (from wind changes)
Fine Scale Climate Projections • What is downscaling • CCAM – Cubic Conformal Atmosphere Model • CSIRO MAR (John McGregor) • Validation phase • IPCC – models are used • Interpolation of pre-existing IPCC scenarios
Example: Hydro Tasmania Inflow Prediction Most important lake • Factor of 1.0 represents no change in inflows • Factors <1.0 represents drying • Factors >1.0 represents wetter • Great Lake factors well below 1.0 and thus drying predicted • Others have drier Summers/Autumns and wetter Winters
Resources • 5 new postdoctoral fellows, 1 liason officer, project management team • Engagement of skills and expertise from the consortia members, including Tasmanian State Departments and business enterprises • $8 million over three years (cash + inkind) • Data Management (TPAC Digital Library) • Potential Collaborations • CERF funded projects • Other initiatives (eg SEACI).
Climate models, and climate model credibility Observations 1980-2000 Mean Model 1980-2000
Projections of Future Changes in Climate Best estimate for low scenario (B1) is1.8°C (likely range is 1.1°C to 2.9°C),and for high scenario (A1FI) is4.0°C (likely range is 2.4°C to 6.4°C). Broadly consistent with span quoted for SRES in TAR, but not directly comparable
Projections of Future Changes in Climate Tasmania • Precipitation increases are very likely in high latitudes in 2090-2099 • Decreases are likely in most subtropical land regions in 2090-2099 Figure SPM-6, TS-30, 10.9
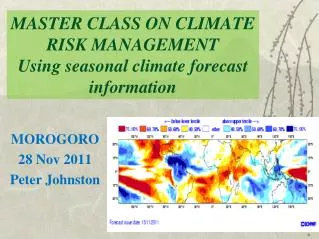
Drought is increasing most places The most important spatial pattern (top) of the monthly Palmer Drought Severity Index (PDSI) for 1900 to 2002. The time series (below) accounts for most of the trend in PDSI.