Download
1 / 47
490 likes | 681 Views
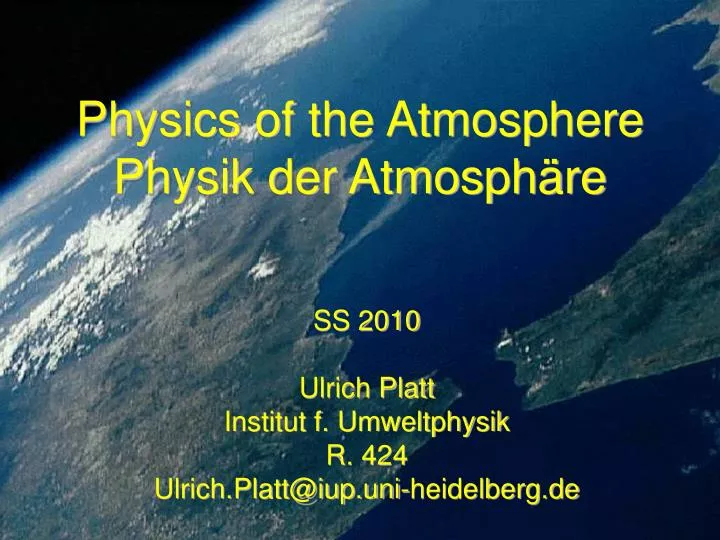
Physics of the Atmosphere Physik der Atmosphäre. SS 2010 Ulrich Platt Institut f. Umweltphysik R. 424 Ulrich.Platt@iup.uni-heidelberg.de. Last Week. “standard” radiation laws are relevant for the atmosphere Rayleigh scattering: σ R ~ λ -4 sky not black

E N D
Physics of the Atmosphere Physik der Atmosphäre SS 2010 Ulrich Platt Institut f. Umweltphysik R. 424 Ulrich.Platt@iup.uni-heidelberg.de
Last Week • “standard” radiation laws are relevant for the atmosphere • Rayleigh scattering: σR ~ λ-4 • sky not black • blue sky during day, red during sun rise/set • Mie scattering: σM ~ λ-1.3, strong forward peak • white sky for high aerosol loading • “photon budget equation” radiative transfer equation • RTE cannot be solved analytically • features of absorption lines • photodissociation – actinic flux • key: NOT perpendicular to surface • remote sensing
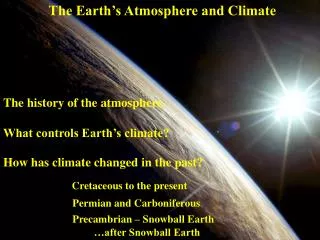
Outline for today • Radiative balance • Greenhouse effect • Latitudinal energy budget – T • Vertical energy budget – T • Global energy budget
Julius von Hann, Handbuch der Klimatologie (1883) Was ist Klima? • Temperatur • Wind • Feuchtigkeit • Niederschlag • …
Earth in the Solar System 1370 W/m2
Solar constant S0 R irradiated area: R2 radiating area: 4R2 The Climate of Earth (Earth Temperature) 1st Approximation:No Atmosphere (SW) Power received from the sun on earth: BSC = S0 = 1368 W/m2 = Solar constant A 0.3 = Albedo of earth 1-A = short-wave absorptivity of earth Re = 6740 Km = Earth radius (IR) power radiated from earth: 0.9 ... 1.0 = IR Emissisivity of earth SB = 5.6710-8 Wm-2K-4 = Stefan-Boltzmann constant
Surface Temperature of Earth. 1st Approximation Since earth is very close to thermal equilibrium and energy exchange can only take place via radiation we have in very good approximation: Substituting for Pout and Pin we obtain the average of surface temperature of earth T0 in 0th approximation: with the above numbers we obtain: T0 255 K Measured average temperature of earth: Te 288 K Cause of the discrepancy: The natural greenhouse effect of 33K. *Note however: “Earth is now absorbing 0.850.15 watts per square meter more energy from the Sun than it is emitting to space.” Hansen J., Nazarenko L., Ruedy R., Sato M., Willis J, Del Genio A., Koch D., Lacis A., Lo K., Menon S., Novakov T., Perlwitz J., Russell G., Schmidt G.A., Tausnev N. (2005), Earth’s Energy Imbalance: Confirmation and Implications, SCIENCE 308, (3 JUNE), 1431-1435.
The ‘Natural Greenhouse Effect’ In summary the “natural’ greenhouse effect amounts to about +33 K Contribution of individual gases (after Kondratyev and Moskalenko, in J.T. Houghton (Ed.), IUP 957, 1984)
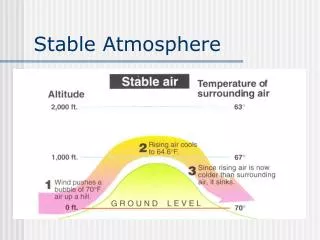
Atmospheric Energy Balance local heating rates: • stratosphere ~ radiative equilibrium • troposphere ≠ radiative equilibrium - “convective adjustment” Brasseur and Solomon, 2005 (IUP-Book 1968) Higher atmosphere is (mainly) cooled by LW and heated by SW radiation
Radiative Equilibrium – Radiative-Convective Equilibrium Specific heating rates (Kelvin/day) Upwelling and down-welling total fluxes heating provided by convection Salby, 1996
Latitudinal Energy Budget of Earth Barry and Chorley, 1998
O3 CO2 LW SW atm. window: ~ground radiates to space Emission Spectra of Earth and Sun Stratosphere: UV-absorption by O3Troposhere: IR-absorption by H2O, CO2, CH4, etc. Atmosphere reduces IR-radiationAtmosphere absorbs and reemits IR radiation
The Greenhouse Effect –Svante Arrhenius Svante Arrhenius 1859-1927
Solar- constant S0 R bestrahlte Fläche: R2 Radiating Area: 4R2 Atmosphericlayer Surface Temperature of Earth. 2nd Approximation Somewhat more realistic greenhouse-model: Atmosphere as thin, IR absorbing and emitting layer („glas roof"). Ground: Temperature TG, IR-(LW) Absorptivity = Emissivity eG, VIS-(SW)Albedo A = Ap Atmosphere: Temperature TA, IR-Absorptivity = Emissivity eA, Completely transparent for short wave radiation
Sum < P1 T2 εA=A T2 <T1 T1 The Effect of Absorbing Layers
Surface Temperature of Earth. 2nd Approximation Radiation equilibrium for both layers: 1) Ground: Atm. radiates upwards and downwards! εA=A 2) Atmosphere: 2 Eq., 2 unknown variables: TA, εA Solution: εA = 0.7 and TA = 239 K (-34 °C) for TB = 288 K Note: Effektive emission from higher, colder layer! T=TB-TA=49K z = T/Γ 49K/9.8Kkm-1 5.0km altitude
Höhe [km] 10 (anthropogenic) enhanced Greenhouse Effect Natural Greenhouse Effect 5 No Atmosphere Temp. [K] 0 250 300 Anthropogenic Greenhouse Effect Natural Greenhouse Effect Greenhouse Effect:Effective Emission height of the LW – Radiation
net net Radiative equilibrium at TOA and surface solar SW: F0 Upwelling and downwelling fluxes and emission in a grey atmosphere that is in radiative equilibrium with an incident SW flux F0 and a black underlying surface. Atmosphere is assumed to be transparent to SW. Note: the emission profile is discontinuous at the surface. Salby, 1996
2x CO2: “emission wins over absorption” Ramanathan
D() 0 Optically dense in the stratosphere Optically dense in the troposphere Optically dense in the near the ground Surface Temperature of Earth. 3rd Approximation: Line-Absorbers The atmosphere is not ‘grey’ but rather a Line-Absorber Frequently the optical density (D = ()cGasz0) at line centre (0) D0 >>1. Consequences: 1. The integral absorption SL of a line: 2. At line centre (0) the atmosphere only becomes optically dense above the tropopause, thus the line centre radiates at higher temperature than the wings of the line.
Spectrum of the Terrestrial (LW) Emission Wavelength (m) IR-Emission measured over Afrika
Sahara Strahlstärke (mWm-2sr-1cm) Strahlstärke (mWm-2cm-1)sr-1cm Mittelmeer Antarktis Wellenzahl (cm-1) Wellenzahl (cm-1) Spectra of Terrestrial (LW) Emission(NIMBUS 4) Bergmann-Schäfer, 1997
Wavelength (m) Cloud O.D. τC with: Ibelow=Iabove·exp(- τC) Long-Wave Emission from Clouds (high) Clouds reduce IR emission heat Earth However: (low) Clouds cool due to high albedo! Net-effect: slight cooling
Earth Radiation Budget Experiment – ERBE (Satellite) Annual Average Net Cloud Radiative Forcing, 1985 - 1986. Net cloud forcing is the result of two opposing effects: (1) greenhouse heating by clouds (or positive forcing), (2) cooling by clouds (or negative forcing) — clouds reflect incoming solar radiation back to space. Overall, clouds have the effect of lessening the amount of heating that would otherwise be experienced at Earth's surface-a cooling effect. (ERBE data on the Earth Radiation Budget Satellite and the NOAA-9 satellite. Data processed at NASA Langley Research Center; image produced at the University of Washington). • cooling - yellow to green to blue • heating - orange to red to pink • overall small net cooling effect by clouds • (image produced at the University of Washington; from NASA webpage, http://terra.nasa.gov/FactSheets/Clouds/)
Energy Budget of Earth (Wm-2, Global Mean) Keihl and Trenberth 1997
Radiation Budget of Earth from Satellite Yearly average of net radiation flux density in W/m2, positive numbers: Gain of radiation energy (net radiation flux downwelling)
No feedback: Antropogenic forcing: (CO2 Doubling) 3.7 W/m2 Climate System T=1.1°C Doubling of the CO2 concentration: temperature increase of about 1.1K Without feedbacks climate predictions would be rather easy Schwartz, S. E. (2007), Heat capacity, time constant, and sensitivity of Earth’s climate system, J. Geophys. Res., 112, D24S05, doi:10.1029/2007JD008746.
3.7 W/m2 Climate system T=1.1 3.0°C (2.5-4°C) Increased water vapour +5 W/m2 +0.8 W/m2 Less snow and ice +1 W/m2 Change in cloudiness -1 W/m2 Change in vertikal Temperature profile -1.5 W/m2 Because of Feedbacks Climate Predictions are Rather Difficult Anthropogenic forcing
Climate Sensitivity equilibriumclimate sensitivity: Equilibrium change in global mean near-surface air temperature that would result from a sustained doubling of the atmospheric (equivalent) CO2 concentration. This value is estimated, by the IPCC Fourth Assessment Report (AR4) as likely to be in the range 2 to 4.5°C with a best estimate of about 3°C With: F2CO2 3.7 W/m2 F = any climate forcing T2CO2 1.1 K We obtain (in linear approximation) for the resulting temperature change T: For the present-day situation we obtain: (For Glacial-Interglacial SC 0.7K(W/m2)-1)
Outlook to 2100 (IPCC 2007) 30GtC/a in 2090 back to 2005 emissions in 2070
Regional Consequences of Climate Change A2: strong CO2 increase 2100: ~850 ppm B2: moderate CO2 increase 2100: ~600 ppm The annual multi-model mean change of the temperature (colour shading) and its range (isolines) (Unit: °C) from OAGCMs. Patterns are very similar, even though scenarios are very different. IPCC
Det. Contributions of the IUP to Climate Research • SW – „extra“ energy absorption in the Atmosphere • Light path lengths in clouds • Greenhouse Gases: CH4 • Cloud – feedback • Carbon cycle • Paleo climate
Satellite Data Evaluation SCanning ImAging spectroMeter for Atmospheric CHartographY (SCIAMACHY) Launch: February 28, 2002 on ENVISAT Spectral resolution 0.2 - 0.4 between 240 und 2400nm Gases: Ozone, NO2 BrO OClO HCHO, SO2 H2O O2 O4 CO, CO2 CH4, N2O Viewing Geometry: Nadir, Limb, direct sun
Satellite Measurements of the Global CH4 Mixing RatioAugust - November 2003 Frankenberg C., Meirink J.F., van Weele M., Platt U. and Wagner T., Assessing methane emissions from global space-borne observations, Science express, March 17, 2005
CH4: Measurement - Model Comparison TM3 Model Data, August - Nov. 2003 Difference: Model - Measured Data (ppb) New CH4-Source(?):Emission from Rainforest Frankenberg et al., Science 2005
Change in Cloud Forcing (1980-1999 vs. 2080-2099)Predicted by Different Models General rule: Low clouds tend to coolHigh clouds tend to warm Main question: Does cloud cover and/or distribution change when climate changes? Changes in global mean cloud radiative forcing (Wm-2) for the period 1980-1999 vs. 2080-2099 IPCC 2007
Dependence of the SCIAMACHY H2O Column on Temperature (ECMWF)(1996-2003) Wagner et al. 2007 Change of the H2O column [1021 molec/cm²] per Kelvin temperature change
Cloud Fraction and Cloud (Top) – Height Observation from Satellite No Cloud: Large O2-Column seen Cloud: Small O2-Column seen
Dependence of the cloud fraction on temperature derived from correlation analysis (1996-2003) Change of the effective cloud fraction (% per K) Higher Temperature Fewer Clouds lower Albedo positive feedback Wagner et al. 2007
Dependence of the Cloud Top Height (from O2) on Temperature1996-2003 Change of cloud top height (km per Kelvin) Higher Temperature Higher Clouds positive feedback on temperature Wagner et al. 2007
Summary • Simple energy balance calculations reveal a lot about our climate: • presence of natural greenhouse effect • latitudinal and vertical structure of T and energy • radiative-convective equilibrium • Feedbacks are important and can only be addressed with numerical models • The global energy budget is in delicate balance, small changes have large effects