Download
1 / 30
300 likes | 464 Views
Mechanisms of drought in present and future climate. Gerald A. Meehl and Aixue Hu. Definition of drought (premise: if it’s not raining it will be dry; must be simple to apply to model analysis)

E N D
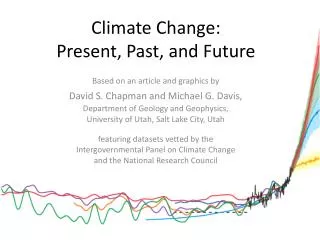
Mechanisms of drought in present and future climate Gerald A. Meehl and Aixue Hu
Definition of drought (premise: if it’s not raining it will be dry; must be simple to apply to model analysis) “Megadrought” (long-lived multi-decadal extreme drought often mentioned in a paleoclimate context): 11 year running mean area-averaged precipitation anomalies over western U.S. less than zero for at least 20 consecutive years (Meehl and Hu, J. Climate, 2006) (one megadrought every 170 years in a 1360 year global coupled climate model control run, or 0.6 megadroughts per century) Is there an analogous simple definition for notorious shorter-lived decadal droughts that have had severe impacts in the U.S. (e.g. the 1930s and 1950s) for Great Plains and western U.S. areas?
Severe decadal drought definition based on historical precedents (1930s and 1950s droughts):negative values of 11 year running mean area-averaged precipitation that exceed one standard deviation for at least 5 consecutive years (rate of 2 per century) 1930s 1950s 1930s 1950s
In another 150 year long dataset, the 1880s drought also qualifies (occurrence rate remains at 2 droughts per century) 1880s 1930s 1950s
Correlations of (11 year running mean) observed western U.S. and Great Plains precipitation with observed SSTs confirms connections to tropical Pacific and Atlantic
Observed decadal pattern (1871-2000), “IPO”, >13 yr low pass Pacific pattern strongly resembles the “Interdecadal Pacific Oscillation” (IPO, Power et al., 1999)
Multi-decadal IPO pattern from long model control run EOF1 of low pass filtered (13 yr) SST EOF1 of band pass filtered (2-7 yr) SST ENSO
Correlation of IPO (multidecadal EOF1 SST) with: Precipitation Sea level pressure (over North America, connected to convective heating anomalies in Pacific)
To look at future changes in decadal droughts: analyze stabilized forcing multi-hundred year global coupled climate model simulations (PCM and CCSM3) “present-day”: 1990 control (300 years) “future”: 2100-2300 from stabilized (at year 2100) A1B scenario (200 years) Severe drought: 11 year running mean precipitation anomalies exceeding 1 σ for at least 5 consecutive years Extreme drought: precipitation anomalies exceeding 2 σ for at least one year during a severe drought, or severe drought conditions for at least 10 consecutive years
Great Plains area (wrt respective climatology; 1 σ = 0.05-0.07): PCM Present: 2 droughts per century; average duration 7.8 years; extreme: 0.7 per century (obs: 2/century, 9.0 yrs, 1.0/century) Future: 0.5 droughts per century; average duration 9.0 years; extreme: 0.5 per century CCSM3 present: 1.1 droughts per century; average duration 11.0 yrs; extreme: 0.9 per century Future: 0.5 droughts per century; average duration 9.0 years; extreme: 0 per century
Western U.S. area (wrt respective climatology; 1 σ = 0.05-0.06): PCM Present (350 yrs): 2 droughts per century; average duration 7.0 yrs extreme: 1.0 per century (obs: 2/century, 9.5 yrs, 0.5/century) Future (200 yrs): 2 droughts per century; average duration 5.3 years; extreme: 1.0 per century CCSM3 present (300 yrs): 2.0 droughts per century; average duration 8.0 yrs; extreme: 0.6 per century Future (200 yrs): 0.5 droughts per century; average duration 8.0 years; extreme: 0.5 per century
Great Plains precipitation correlated with SSTs (11 yr running means) dominant connection with tropical Pacific (cold tropical Pacific = dry Great Plains); Future pattern somewhat weakened compared to present, but qualitatively similar present-day future CCSM3 PCM
Western U.S. precipitation correlated with SSTs (11 yr running means) dominant connection with tropical Pacific (cold tropical Pacific = dry Western U.S.); Future pattern somewhat weakened compared to present, but qualitatively similar CCSM3 PCM
There are significant contributions of multi-decadal Pacific SST anomalies (IPO/PDO) to severe drought over both the Western U.S. and Great Plains Therefore, understanding the mechanism of severe drought over North America requires (at least) understanding the mechanism of the IPO/PDO that produces the multidecadal SST anomalies
______ Mechanism for multi-decadal SST and precipitation variability in the Indo-Pacific region (Meehl, G. A., and A. Hu, 2006, Journal of Climate,19, 1605–1623.)
CMIP3 multi-model future changes of season-averaged precipitation show large seasonal changes in the pattern over North America (dry in far southwest U.S. and Mexico during winter; dry over the Pacific northwest and southern Great Plains in summer) Fig. SPM-6 Stippled areas are where more than 90% of the models agree in the sign of the change Precipitation increases very likely in high latitudes Decreases likely in most subtropical land regions This continues the observed patterns in recent trends
Average future JJA surface temperature change shows relatively greater warming in western U.S. due to changes in circulation (more ridging over western U.S.) associated with convective heating anomalies in tropical Pacific
Proportionately greater increases of western U.S. temperature (and decreased precipitation) increase vulnerability to future drought in terms of precipitation and evaporation (P minus E becomes more negative there in future)
Western U.S. P minus E mean base state climate change for JJA PCM: -0.21 mm day-1 CCSM3: -0.08 mm day-1 1 σ for both about 0.01 to 0.02 mm day-1 JJA base state change roughly an order of magnitude greater than one standard deviation, so virtually every year in future climate would be a severe drought year by present-day standards
Great Plains P minus E mean base state climate change for JJA PCM: -0.12 mm day-1 CCSM3: -0.02 mm day-1 1 σ for both about 0.04 to 0.06 mm day-1 JJA base state change produces a tripling of severe drought in PCM, and a doubling of severe drought in CCSM3
Conclusions • Severe droughts over two areas of North America (western US and Great Plains) defined in relation to historical severe droughts of 1930s and 1950s in terms of multi-decadal precipitation anomalies • Similar patterns of SSTs that drive present-day droughts (relative cool tropical Pacific SSTs) also drive future droughts; a warmer base state appears to qualitatively reduce drought severity somewhat with respect to the new future climate • A mechanism proposed to explain the decadal pattern of SSTs in the tropical Pacific associated with droughts over North America involves coupled interactions between tropics-midlatitudes and ocean-atmosphere with wind-forced ocean Rossby waves near 25N and 25S providing the decadal timescale • In relation to present-day droughts, future summertime droughts more severe due to warmer mean temperatures and enhanced evaporation (P minus E becomes more negative) • In western U.S. every year is a severe drought year in future compared to present drought regime; over Great Plains there is a doubling to tripling of severe droughts in future compared to present
Can we predict North American droughts 10 to 30 years in advance? • “Decadal prediction” regional skill could come from three sources: • Climate change commitment from the forcing already in the system • Climate change from the forcing from ongoing increases of GHGs • Predicting time-evolving regional decadal phenomena whose mechanisms could be captured in an initialized climate state (e.g. PDO/IPO, MOC, AMO, etc.)
An example: EOF1 from a model 20th century simulation is the forced trend Let’s see if we can predict EOF2 (the internally generated IPO pattern associated with North American drought) in a perfect model ensemble experiment
Decadal predictions of IPO index for the Pacific 9 out of 29 members (31%) show some predictive skill out to 20 years (CCSM3.0, T42, atmospheric initial state perturbed with same ocean initial state at year 2000; one reference, 29 ensemble members)
CMIP5 Decadal Predictability/Prediction core model runs: • 1.1 10 year integrations with initial dates towards the end of 1960, 1965, 1970, 1975, 1980, 1985, 1990, 1995 and 2000 and 2005 • Ensemble size of 3, optionally to be increased to O(10) • Ocean initial conditions should be in some way representative of the observed anomalies or full fields for the start date • Land, sea-ice and atmosphere initial conditions left to the discretion of each group • Model run time: 300 years (optionally, an additional 700 years) • 1.2 Extend integrations with initial dates near the end of 1960, 1980 and 2005 to 30 yrs. • Each start date to use a 3 member ensemble, optionally to be increased to O(10) • Ocean initial conditions represent the observed anomalies or full fields. • Model run time: 180 years (optionally, an additional 420 years)