Download
1 / 35
350 likes | 513 Views
Bayesian network-based predictive analytics applied to invasive species distribution. Wisdom Mdumiseni Dlamini -PhD Student / Director of Nature Conservation- University of South Africa / Swaziland National Trust Commission. Outline of the Talk. Aims Introduction

E N D
Bayesian network-based predictive analytics applied to invasive species distribution Wisdom Mdumiseni Dlamini -PhD Student / Director of Nature Conservation- University of South Africa / Swaziland National Trust Commission
Outline of the Talk • Aims • Introduction • Invasive alien plant species distribution modelling • Bayesian networks (BNs) • Methods (Predictive analytics –data mining using BNs) • Findings • Conclusions and on-going research.
Aims • Investigate suitability of Bayesian networks (BNs) for species distribution (geospatial) data analysis (Chromolaena odorata and Lantana camara cases in Swaziland) • Apply BN learning for geospatial predictive analytics (data mining) and ecological knowledge discovery • Demonstrate potential/usefulness of BN-based data mining for geospatial analysis and decision-making
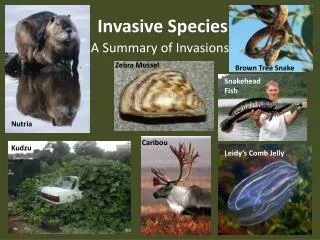
Introduction • Invasive alien plants are problematic in Swaziland and the world over. • 80% of country invaded and about 400 invasive plant species in total • Four plant species identified and declared a disaster in 2005 due to threat the economy and food security in Swaziland (Chromolaena odorata, Solanum mauritiunum, Caesalpinia decapetala and Lantana Camara) • Degraded rangelands, reduced water flows in streams/rivers, threat to native flora and biodiversity. • Estimate cost: ~3% of GDP to control these. • Need for geospatial information for control, planning and decision-making and understanding their ecology
Introduction Chromolaenaodorata (Photos R. Mackenzie) Lantana camara Photo: K Braun
Introduction Photo: E.M. Ossom
Invasive alien plant species distribution modelling • All species distribution modeling approaches model the function approximating the true relationship between the environment and species geographic occurrences/distribution. • Objective is to estimate some function f = μ(Gdata, E) - i.e. applying an algorithm to data given an environmental space E to estimate G (distribution) • Used in ecology to: • model present, past and future distribution of species • predicting disease spread • predicting invasive species spread • niche conservation
Invasive alien plant species distribution modelling (ceveats) • Many algorithms do not handle asymmetric data • Many don’t handle interaction effects • Some do not handle nominal/categorical environmental variables (e.g. vegetation types) • Many stochastic algorithms present different solutions even under identical parameterization and input data • ‘real’ distribution of species not known, so we do not know when models are making mistakes and when are filling knowledge gaps.
Invasive alien plant species distribution modelling (ceveats) • Which factors determine the distribution of species: • The answer is often complicated (but important) • Species have physiological tolerances, migration limitations and evolutionary forces that limit adaptation • A starting point for physiology may be traits • A starting point for abiotic factors is often climate • Climate variables often also correlate with other variables (e.g. elevation, land cover)
Invasive alien plant species distribution modelling • Need for algorithms that will address the issues in previous slide • Additionally, conventional SDMs are correlative and do not adequately capture causal species-environment relationships and ecological knowledge • There remains a critical gap in the understanding of processes that induce observed invasion spatial patterns
Bayesian networks • A BN is a graphical model that encodes probabilistic relationships among a set of variables • Two components: • Directed Acyclic Graph (DAG) • Probability Table • Variables depicted as nodes • Arcs represent probabilistic dependence between variables • Conditional probabilities encode the strength of dependencies • Lack of an arc denotes a conditional independence
Bayesian networks • Bayes theorem : the posterior probability for given D and a background knowledge : p(/D, ) = p( / ) p (D/ , ) P(D / ) Where p(D/ )= p(D/ , ) p( / ) d Note : is an uncertain variable whose value corresponds to the possible true values of the physical probability
Bayesian networks A Bayesian network represents potentially causal patterns, which tend to be more useful for intelligent decision making Bayesian network example A B However, algorithms for constructing Bayesian networks from data were not designed to discover interesting patterns C Combined novel feature selection and structure learning is interesting by nature D Causality + interestingness tends to improve Usefulness
Bayesian networks • BNs can readily handle incomplete (missing) data • BNs allow one to learn about causal relationships • BNs readily facilitate use of prior knowledge • Bayesian methods provide an efficient method for preventing the over fitting of data (there is no need for complex pre-processing and data transformation) • BNs also handle uncertainty very well • Graphical nature readily allows for interpretation of interrelationships/interactions between variables
Methodology • Identify the modelling goals • Identify many possible observations/variables that may be relevant to the problem • Determine what subset of those observations is worthwhile to model • Organize the observations into variables having mutually exclusive and collectively exhaustive states. • Build a Directed Acyclic Graph that encodes the assertions of conditional independence • Use the graph to describe the ecology species invasion patterns and processes
Methodology • “Knowledge Discovery in Databases (KDD) is the non-trivial process of identifying valid, novel, potentially useful, and ultimately understandable patterns in data”(Fayyad et al., 1996) • Focus on the quality of discovered patterns • A lot of research on discovering valid, accurate patterns • Little research on discovering potentially useful patterns • Data Mining consists of extracting patterns from data, and is the core step of the knowledge discovery process
Methodology • Species distribution data obtained from 2009 aerial survey (~50m altitude flight throughout country) – GPS coordinates from experts. • 115 geospatial data sets covering biophysical, climatic, socio-economic and topographic data. • All processed to rasters/grids of uniform size (~1km) • Raster geodatabase created and exported to CSV file
Methodology • CSV file imported to Weka (open source machine learning/data mining package) for analysis • Most species occurrence data was imbalanced (i.e. too many absence (-ve) than presence (+ve) instances) - Sampling variation and/or noisy data may mislead the BN construction method, further contributing to the discovery of a sub-optimal BN. • Data balancing implemented using Spread Subsample approach • Discretization (using Minimum Description Length (MDL) criterion with Kononenko correction)
Methodology • The problem of constructing the optimal net is too complex in large datasets • Feature selection • Hybrid approach: GainRatio Attribute Evaluation followed by Peng’s maximum Relevance minimum Redundancy (mRmR) subset evaluation algorithm based on Correlation-based Feature Subset (CFS) selection and Symmetric Uncertainty • The CFS search was done via particle swarm optimization (PSO) • Done to reduce data dimensionality and redundancy whilst simultaneously ensuring that only relevant, predictive and uncorrelated features (variables) are selected
Methodology • Various structure learning approaches being implemented and tested on final subset of variables. • Both local and global search strategies were implemented using Bayes score. • Methods based on search guided by a scoring function • Iteratively create candidate solutions (BNs) and evaluate the quality of each created network using a scoring function, until a stopping criteria is satisfied • Sequential methods consider a single candidate solution at a time • Population-based methods consider many candidate solutions at a time
Methodology • Conditional independence based algorithms also used (CI and Inductive Causation (ICS) to extract causal relationships. • Not scalable to datasets with many variables (attributes) • Markov blanket applied in all cases (i.e. all variables constitute the set of parents and children and parents of children of the class variable).
Methodology • Examples of sequential method • Hill climbing algorithm starts with an empty network and at each iteration adds, to the current candidate solution, the edge that maximizes the value of the scoring function • K2 algorithm requires that the variables be ordered and the user specifies a parameter: the maximum number of parents of each variable in the network to be constructed • Both are greedy methods (local search), which offer no guarantee of finding the optimal network • Population-based methods are global search methods, but are stochastic, so again no guarantees
C. odorataBN NB: the probabilistic dependencies between variables
Note the complexity on spatial distribution highlighting a complex interplay of factors
Identified invasion hotspots not identified by training data but verified with independent tree atlas data
L. camaraBN NB: the probabilistic dependencies between variables
Identified invasion hotspots not identified by training data but verified with independent tree atlas data
Findings • Distinguishing properties of BNs: • their ability to reduce the joint probability distribution of the model into a set of conditional probabilities • their capability to express model uncertainties, • propagate information quickly, • represent complex topologies, • combine domain knowledge with hard data, and update model parameters as new information becomes available.
Conclusions • We proposed a method for integrating feature selection and BN learning algorithms in non-spatial and geospatial data mining • Algorithms for constructing Bayesian networks • Discover potentially causal, more useful patterns • Discover surprising patterns, potentially more useful • Hopefully, combining the “best of both worlds”, increasing the chance of discovering ecological patterns and processes useful for intelligent decision making and invasion plant species management • Ongoing research: computational implementation of the proposed method and ecological knowledge discovery to 14 other species.
Conclusions • Geospatial predictive analytics: an emerging field in ‘big data’ era. • Applicability of our method to broader natural resource management and geospatial analysis in particular where both prediction and decision-making are paramount. • Accessibility and sharing are crucial if we are to reap maximum benefits from geospatial data • (A)Spatial data repositories/SDI could act as good data mines from which to extract patterns to solve various socio-economic/NRM problems.
Questions ?? Thanks you for listening!