Download
1 / 18
180 likes | 359 Views
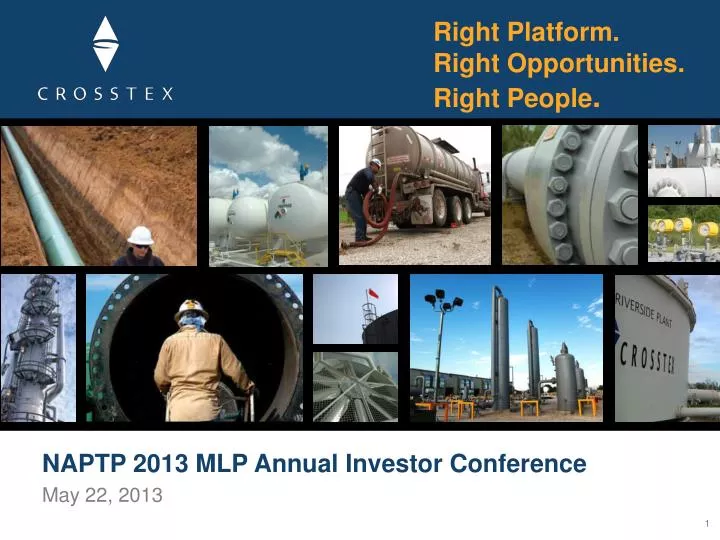
Right Platform. Right Opportunities. Right People . . NAPTP 2013 MLP Annual Investor Conference. May 22, 2013. Forward-Looking Statements & Non-GAAP Financial Information.

E N D
Right Platform. Right Opportunities. Right People. NAPTP 2013 MLP Annual Investor Conference May 22, 2013
Forward-Looking Statements &Non-GAAP Financial Information This presentation contains forward looking statements within the meaning of the federal securities laws. Forward-looking statements are not guarantees of performance. They involve risks, uncertainties and assumptions. The future results of Crosstex Energy, L.P., Crosstex Energy, Inc. and their respective affiliates (collectively known as “Crosstex”) may differ materially from those expressed in the forward-looking statements contained throughout this presentation and in documents filed with the Securities and Exchange Commission (SEC). Many of the factors that will determine these results are beyond Crosstex’s ability to control or predict. These statements are necessarily based upon various assumptions involving judgments with respect to the future, including, among others, prices and market demand for natural gas, natural gas liquids (NGLs), condensate and crude oil; drilling levels; the ability to achieve synergies and revenue growth; national, international, regional and local economic, competitive and regulatory conditions and developments; technological developments; capital markets conditions; inflation rates; interest rates; the political and economic stability of oil producing nations; energy markets; weather conditions; business and regulatory or legal decisions; the pace of deregulation of retail natural gas and electricity; the timing and success of business development efforts; and other factors discussed in Crosstex’s Annual Reports on Form 10-K for the quarter ended March 31, 2013 and their other filings with the SEC. You are cautioned not to put undue reliance on any forward-looking statement. Crosstex has no obligation to publicly update or revise any forward-looking statement, whether as a result of new information, future events or otherwise. This presentation also contains non-generally accepted accounting principle financial measures that Crosstex refers to as adjusted EBITDA, distributable cash flow, growth capital expenditures, maintenance capital expenditures and segment cash flow. Adjusted EBITDA is defined as net income (loss) plus interest expense, provision for income taxes and depreciation and amortization expense, impairments, stock-based compensation, loss on extinguishment of debt, (gain) loss on noncash derivatives, transaction costs associated with successful transactions, minority interest and certain severance and exit expenses, and accrued expense of a legal judgment under appeal, less (gain) loss on sale of property. Distributable cash flow is defined as earnings before certain noncash charges and the (gain) loss on the sale of assets less maintenance capital expenditures. The amounts included in the calculation of these measures are computed in accordance with generally accepted accounting principles (GAAP) with the exception of maintenance capital expenditures. Segment cash flow is defined as revenue minus the cost of purchased gas and natural gas liquids and operating and maintenance expenditures. Growth capital expenditures is defined as all construction-related direct labor and material costs, as well as indirect construction costs including general engineering costs and the costs of funds used in construction. Maintenance capital expenditures are capital expenditures made to replace partially or fully depreciated assets in order to maintain the existing operating capacity of the assets and to extend their useful lives. Reconciliations of these measures to their most directly comparable GAAP measures are in the tables in the Appendix. Crosstex believes these measures are useful to investors because they may provide users of this financial information with meaningful comparisons between current results and prior-reported results and a meaningful measure of Crosstex’s cash flow after it has satisfied the capital and related requirements of its operations. Adjusted EBITDA, distributable cash flow, growth capital expenditures, maintenance capital expenditures and segment cash flows, as defined above, are not measures of financial performance or liquidity under GAAP. They should not be considered in isolation or as an indicator of Crosstex’s performance. Furthermore, they should not be seen as measures of liquidity or a substitute for metrics prepared in accordance with GAAP.
Compelling Investment Opportunity The Right Energy Market Positioned to benefit from a robust energy environment The Right Platform: Strategic Asset Base Strategically located assets and the right MLP / GP structure High quality management with significant industry experience The Right People: Experienced Team Ability to deliver transformative growth with a keen focus on fee-based projects that have geographic and product diversity The Right Opportunities: Transformative Growth The Right Time To invest in the Crosstex transformation
The Right Energy Market Pipeline Infrastructure Capital Spending Needed Per Year in the U.S.*** Projected U.S. Supply/Demand Balance * (Liquid Petroleum Products Volume, 000 Bbl/d) (2011 – 2035, $MM) 70% Decrease in Imports | 2005 | 2006 | 2007 | 2008 | 2009 | 2010 | 2011 | 2012 | 2013 | 2014 | 2015 | 2016 | 2017 | 2018 | 2019 | 2020 | U.S. Shale Gas Marketed Production ** (Bcf/d) • * Source: PIRA Energy Group • ** Source: Energy Information Administration (EIA) *** Source: Interstate Natural Gas Association of America Surging U.S. Production Requires the Re-Piping of America, With Expected Midstream Investment of $10 Billion Annually for 20+ years ***
The Right Platform: Delivering Diversified Midstream Solutions The Midstream Value Chain A critical part of energy infrastructure responsible for moving product from well-head to consumption
The Right Platform:Diverse Base of Assets Processing Plants Fractionators Pipelines Crude/Brine Truck Stations Brine Disposal Wells Rail Terminal Barge Terminal OHIO RIVER VALLEY Oklahoma Pennsylvania Arkansas Ohio MARCELLUS X West Virginia Louisiana UTICA HAYNESVILLE & COTTON VALLEY X PERMIAN BASIN BARNETT SHALE TUSCALOOSA MARINE SHALE AUSTIN CHALK Texas MIOCENE/WILCOX EAGLE FORD Well Positioned in 6 of the Top Shale / Resource Plays in the U.S.
The Right People • Management team averages 25 years of experience • Diversified employee base with strong experience- Field employees have ~20 years of industry experience. • ~750 “best in class” employees • High employee engagement = corporate success
The Right Opportunities: Cajun-Sibon Expansion Projects • Highlights: • ~139-mile pipeline from NGL supply hub in South Texas to Crosstex’s NGL fractionation assets in South Louisiana • Total expected growth capital expenditures for Phase I and Phase II of project: $680-$700MM • Supported by long-termsales agreements with Dow Hydrocarbons and Williams companies • Expected run-rated adjusted EBITDA contribution of Phase I and Phase II: $115-$130MM • Phase I projected to be complete in mid-year 2013 • Phase II projected to be complete in second half of 2014 Processing Plants Fractionators PNGL Pipeline New Cajun-SibonPipelines NGL Storage Third Party Plant AUSTIN CHALK TUSCALOOSA MARINE SHALE Eunice Plaquemine CAJUN-SIBON EXPANSION Riverside Mont Belvieu Napoleonville Blue Water Pelican Gibson Sabine Pass MIOCENE/WILCOX Cajun-Sibon project significantly grows Crosstex’s business by leveraging key customer relationships and South Louisiana fractionation assets and infrastructure.
The Right Opportunities:Robust Market for NGLs in South Louisiana Louisiana Petrochemical Capacity / Expansions Crosstex Source: Hodson Report estimates, December 2012 Basins Shale Plays Approximately 30% of U.S. ethylene capacity is in the Louisiana Market
Crosstex Energy, Inc. Investing in E2 Company Investment Highlights • Crosstex joined with Enerven to form a new company (E2) to provide services for producers in the Utica • Crosstex Energy, Inc. to invest approximately $75 million in new natural gas compression and condensate stabilization facilities • E2 will construct, own, and operate three compression and condensate stabilization assets for development of Antero Resources Utica acreage in Noble and Monroe counties * • Expected commercial operations start up Q4 2013 * The location of the third compressor station is still being finalized as of May 7, 2013. 10
The Right Opportunities: Transformative Growth 2010 2013 * Est. Q4-14 Run Rate Gas 41% Gas 92% Gas 59% Segment Cash Flows by Product Crude / Condensate / NGL / Brine 41% Crude / Condensate / NGL / Brine 59% NGL 8% Segment Cash Flows by Contract Type Commodity Sensitive 30% Commodity Sensitive 14% Fee-Based 87% Commodity Sensitive 13% Fee-Based 70% Fee-Based 86% Note: Segment Cash Flow is a non-GAAP financial measure and is explained on page 2. See Appendix for reconciliation to Operating Income. * 2013 estimates represent the midpoint of previously announced 2013 guidance.
The Right Time to Invest in Crosstex:Forecasting Significant Growth Adjusted EBITDA ($ in MM) • Asset base provides geographic and product diversity • Growth projects focused on fee-based crude and NGL businesses • Expect run-rate adjusted EBITDA of ~$260-$290 MM by the end of 2013, driven by well defined fee-based growth projects $220-$250 $260-$290 Note: Adjusted EBITDA and Distributable Cash Flow are non-GAAP financial measures and are explained in greater detail on page 2. See appendix for reconciliations to GAAP measures. * Q4 2013 estimated annualized guidance ranges shown. ** Growth percentages represent increases from 2012 XTEX distributions of $1.32 per unit and XTXI dividends of $0.48 per share.
Compelling Investment Opportunity The Right Energy Market Positioned to benefit from a robust energy environment The Right Platform: Strategic Asset Base Strategically located assets and the right MLP / GP structure High quality management with significant industry experience The Right People: Experienced Team Ability to deliver transformative growth with a keen focus on fee-based projects that have geographic and product diversity The Right Opportunities: Transformative Growth The Right Time To invest in the Crosstex transformation
Reconciliation: Segment Cash Flow to Operating Income * 2013 estimates represent the midpoint of previously announced 2013 guidance. ** Other includes LOC fees, stock based compensation and gains or losses on derivatives.
Reconciliation: Net Loss to Adjusted EBITDA and Distributable Cash Flow * 2013 estimates represent the midpoint of previously announced 2013 guidance. ** Other adjustments includes stock-based compensation, loss on extinguishment of debt, (gain) loss on noncash derivatives, transaction costs associated with successful transactions, minority interest and certain severance and exit expenses, and accrued expense of a legal judgment under appeal, less (gain) loss on sale of property.
The Right Time to Invest in Crosstex:Two Investment Opportunities PUBLIC SHAREHOLDERS BLACKSTONE / GSO Crosstex Energy, Inc. (XTXI) ~$900 Million Market Capitalization 1 XTXI is a “C” corporation that owns the general partner interest, the incentive distribution rights and a portion of the limited partner interests in Crosstex Energy, L.P. as well as the majority interest in a services company focused on the Utica Shale play in the Ohio River Valley. PUBLIC UNITHOLDERS Crosstex Energy, L.P. (XTEX) ~$1.5 Billion Market Capitalization 2 XTEX is a master limited partnership, or MLP, that owns the operating assets of Crosstex’s business. MLPs generally are not subject to federal income tax, and items of income, gain, loss and deduction are passed through to the partners. NASDAQ Symbols: XTEX (MLP) XTXI (Corporation) 1 XTXI’s market capitalization is with a trading price of $18.11 and 48 million shares outstanding as of May 6, 2013. 2 XTEX’s market capitalization is with a trading price of $18.64 and 78 million units outstanding as of May 6, 2013.