Download

1 / 64
690 likes | 912 Views
Satellite geodesy (ge-2112). Applications E. Schrama. Applications. Global Positioning System Precise point positioning services Detection of platetectonics estimation of wet tropospheric delay International Earth Rotation Service Earth rotation parameters + LOD

E N D
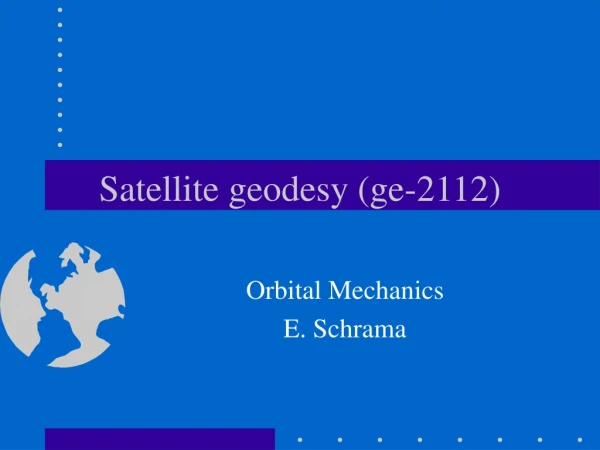
Satellite geodesy (ge-2112) Applications E. Schrama
Applications • Global Positioning System • Precise point positioning services • Detection of platetectonics • estimation of wet tropospheric delay • International Earth Rotation Service • Earth rotation parameters + LOD • Interpretation of these Earth rotation variables (AAM) • Satellite altimetry • status 2002, where are we, how did it emerge, results • Results from gravity missions
GPS: precise point positioning • Concept of differencing • Single differencing • Double differencing • Triple differencing • Software • Bernse software • GIPSY JPL • Other software
Concept of differencing • In the GPS system, many observations are made at the “same” time by difference receivers. • All receivers collect pseudo range data, carrier phase data and navigation messages • The Pseudo range navigation allows you to get a approximate solution for receiver coordinates (approx 3 m) • More importantly is that the pseudo range navigation solution allows to synchronize all receiver clocks to the (approx 10 nano seconds, nsec). • The pseudo-range solution requires orbit information • The dual frequency concept results in ionospheric free ranges and carrier phase estimates • From this point on we start to work with “differencing techniques”,
Single differences SAT(1) SAT(2) r1a r2a RCV(a) Single Difference = r1a - r2a
Double differences SAT(1) SAT(2) r2b r1a r2a r1b RCV(b) RCV(a) Double Difference = (r1a - r2a) - (r1b-r2b)
Difference data processing • Single differences (as shown two sheets before this one) are insensitive to receiver clock errors • Double differences are insensitieve to all receiver and satellite clock errors • Triple differences (= differences of double differences at consequetive epochs) reveal jumps in carrier phase data. • Differencing techniques as described above result in observation equations that allow one to solve for coordinate delta’s (improvements) • Available software to do this: GIPSY (JPL) + Bernese SW
GPS to observedeformation around a vulcano on Hawaii Ref: http://www.unavco.org/research_science/science_highlights/kilauea/kilauea.html
Plate Tektonics Source: Unavco Brochure
GPS: Wet troposphere (cm) http://www.gst.ucar.edu/gpsrg/realtime.html
Ionosphere from GPS (TEC) http://www.gst.ucar.edu/gpsrg/realtime.html
IERS: Length of day variations The atmosphere (left) and the ocean tides (right) correlate with space geodetic observations of the length of day (LOD) source: NASA
Satellite Altimetry By means of a nadir looking radar we measure the reflection of short pulse in the footprint. This footprint is about 4 to 8 kilometer in diameter. Source: JPL
Pulse reflection power Sent time power Received time
Technical evolution • SKYLAB 1972 NASA 20 m • GEOS-3 1975-1978 NASA 3 m • SEASAT 1978 NASA 2 m • GEOSAT 1985-1990 US Navy 30 cm • ERS-1 1991-1996 ESA 4-10 cm • ERS-2 1995- ESA 4 cm • T/P 1992- NASA/CNES 2 - 3 cm • GFO 2000- US Navy • JASON 2001- NASA/CNES 2 - 3 cm • ENVISAT 2002- ESA
ERS-1 1991-1996 Topex/Poseidon 1992 - ERS-2 1995- Geosat (1985-1990) Recent and operational systems
Doris tracking network Source: CNES
ERS-1/2 tracking + cal/val Source: DEOS
119 121 120 122 T/P sampling
Kelvin and Rossby waves Equator: 2.8 m/s 20 N: 8.5 cm/s
Pacific decadal oscillation Since 1999 1977-1999
Examples of ocean tides This shows a 7 meter tidal height difference in Brittany France (Pentrez Plage)
Tides in the South China Sea M2 wave