Download
1 / 23
230 likes | 577 Views
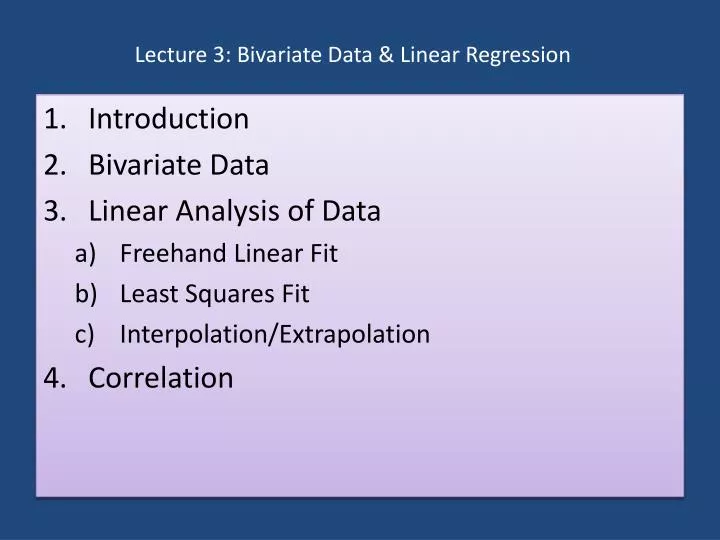
Lecture 3: Bivariate Data & Linear Regression. Introduction Bivariate Data Linear Analysis of Data Freehand Linear Fit Least Squares Fit Interpolation/Extrapolation Correlation. 1. Introduction. Motivation. Visual analysis of data, though useful, is limited

E N D
Lecture 3: Bivariate Data & Linear Regression • Introduction • Bivariate Data • Linear Analysis of Data • Freehand Linear Fit • Least Squares Fit • Interpolation/Extrapolation • Correlation
1. Introduction Motivation • Visual analysis of data, though useful, is limited • We use other methods to determine if there is a sufficiently strong relationship between two measurements to possibly eliminate the necessity of making both measurements • In many fish, there is a very strong relationship between length and body mass, so that measuring the length alone can provide a very good estimate of the individual’s weight • Organisms with determinant growth patterns may also have a very strong relationship between their size and age, so that measurements of individual size may be useful in estimating an individual’s age • In these cases an objective is to determine an equation which allows you to estimate one measurement from another measurement that might be easier to make.
1. Introduction Linear Relationships • A linear relationship between two measurements is the simplest description of a strong relationship • Knowing one measurement allows you to find the other by just looking at the associated point on the line • Linear relationships arise in many biological situations, particularly if the data are rescaled (see ch. 4) to account for factors that interact in a non-linear manner • Recall the slope-intercept form for a line: we will need to go this direction
2. Bivariate Data • Bivariate data are measurements made on two variables per observation • Bivariate data are often displayed as ordered pairs (x1, y1), (x2, y2), …, (xn, yn) or in a table: • A regression is a formula that describes the relationship between variables. A linear regression is one in which the relationship can be expressed in the equation of a line. In this case, we find a line of best fit to describe the relationship.
3. Linear Analysis of Data Freehand Linear Fit • See if the data appear to be linearly related • Make a scatter plot of the data. Choose your axes so that the range is approximately the same as that in your data • Which is the horizontal axis and which is the vertical? • If one is the dependent (e.g. body weight depends on age, rather than the reverse), then choose the one that is dependent (weight) as the vertical axis and the independent one (age) as the horizontal axis • If you do not have any reason to expect that one of the measurements is dependent on the other, then choose one and go with it • Eyeball the data and see if there appears to be any relationship. If the scatter plot looks like the points might be described approximately by a line then it is reasonable to proceed with fitting a line
3. Linear Analysis of Data Freehand Linear Fit • Draw a freehand line that estimates the line of best fit; that is, draw a line through the data, trying to minimize the vertical distance between the line and the points: vertical orthogonal • Using two points ON THE LINE (not necessarily data points), find the equation of the line.
3. Linear Analysis of Data Example 3.1 (Freehand Linear Fit) Given the following set of bivariate data, use the freehand method to find a linear equation that fits the data. Step 1: Make a scatterplot: The data seem reasonably linearly related, so we go to the next step.
3. Linear Analysis of Data Example 3.1 (Freehand Linear Fit) Step 2: Draw a line through the data that attempts to minimize the (vertical) distance between the line and the points: Notice that our line contains none of the data points!
3. Linear Analysis of Data Example 3.1 (Freehand Linear Fit) Step 3: Next we pick two points ON THE LINE to determine the equation of the line. Let’s choose (3,6) and (6,10). Then:
3. Linear Analysis of Data Least Squares Fit We want to find and to minimize the sum of errors squared:
3. Linear Analysis of Data Least Squares Fit Using some simple calculus techniques, one can easily discover that the best such values are given by where
3. Linear Analysis of Data Example 3.2 (Least Squares Linear Regression) Given the same set of data as before, use the Least Squares method to find a linear equation that fits the data. Step 1: Find the arithmetic means for x and y: Step 2: Find Sxy and Sxx:
3. Linear Analysis of Data Example 3.2 (Least Squares Linear Regression) Step 3: Find and : Step 4: Write down the equation: Compare with our freehand approximation:
3. Linear Analysis of Data Interpolation & Extrapolation • Our linear least squares fitted line is a simple mathematical model for the dataset. Models can be used to describe relationships and make predictions about some physical system. • As an example, we can use the linear equation to predict y-values for certain x-values: • If the given x-value lies within the range of x-values for our dataset, then the predicted y-value is an interpolation • If the given x-value lies outside the range of x-values for our dataset, then the predicted y-value is an extrapolation
3. Linear Analysis of Data Interpolation & Extrapolation: Example 3.3 Using the data and best fit line found in Example 3.2, estimate the y value that would correspond with the following x values: (a) x = 5, and (b) x = 10. Which corresponds with performing an interpolation and which with an extrapolation? Solution: • x=5: interpolation • x=10: extrapolation
4. Correlation • We’d like to know if our LSR is good. • Two sets of measurements are “correlated” if there appears to be some relationship between them • In this section we present formulae applicable only for linear correlation • Correlated does not imply causally related; e.g. leaf length and width
4. Correlation Correlation Coefficient • The correlation coefficient rho is given by: • This value will always be between -1 and 1 • If ρ = -1, data are perfectly negatively correlated; if close, highly negatively correlated • If ρ = 0, data are uncorrelated; note: this only means they are not linearly related • If ρ = 1, data are perfectly positively correlated; if close, highly positively correlated • ρ2 x 100 tells us the percent of the variance accounted for by the LSR
4. Correlation Figure 3.1 Various sets of data with their corresponding correlation coefficient shown above each data set. Notice in the bottom row that there can be a correlation in the data, but the value for the correlation coefficient ρ is zero because there is not a linear correlation
4. Correlation Example 3.4 How correlated is the data presented in Example 3.1? • In order to use the formula, we need to calculate Syy: • We have, then, the correlation coefficient: highly correlated • Finally, ρ2 = .8464, so 85% of the variance in the dataset is accounted for by the LSR line
Homework • Chapter 1: 1.2 - 1.5 • Chapter 2: 2.2–2.4, 2.7, 2.9, 2.10 • Chapter 3: 3.3, 3.4, 3.9
Homework Exercise 3.4 (d) The average length and width of various bird eggs are given in the following table. Step 1: Find the arithmetic means for x and y: Step 2: Find Sxy and Sxx:
Homework Exercise 3.4 (d) Step 3: Find and : Step 4: Write down the equation:
Homework Exercise 3.4 (e) • In order to use the formula, we need to calculate Syy: • We have, then, the correlation coefficient: highly positively correlated • Finally, ρ2 = .9975, so 99.75% of the variance in the dataset is accounted for by the LSR line