Download
1 / 16
160 likes | 460 Views
Overview of GAISE report. Math Alliance September 2011. NCTM Problem Solving Standard. Problem Solving Standard Instructional programs from prekindergarten through grade 12 should enable all students to: • Build new mathematical knowledge through problem solving

E N D
Overview of GAISE report Math Alliance September 2011
NCTM Problem Solving Standard Problem Solving Standard Instructional programs from prekindergarten through grade 12 should enable all students to: • Build new mathematical knowledge through problem solving • Solve problems that arise in mathematics and in other contexts • Apply and adapt a variety of appropriate strategies to solve problems • Monitor and reflect on the process of mathematical problem solving
Problem Solving Example Farmer Brown was rounding up his animals when a wind storm swept up. He wasn’t sure if he had all of the animals herded into the barn. He counted 12 heads and 32 feet. Tell Farmer Brown how many chickens and cows he has rounded up into the barn.
Oreo Cookies One Oreo cookie contains 53 calories One Triple Double Oreo cookie contains 100 calories How many calories in one wafer?
PROBLEM SOLVING STRATEGIES FROM GEORGE POLYA George Polya (1887 – 1985) was one of the most famous mathematics educators of the 20th century. Dr. Polya strongly believed that the skill of problem solving could and should be taught – it is not something that you are born with. He identified four principles that form the basis for problem solving:
Polya’s Steps 1. Understand the problem • Devise a plan • Carry out the plan 4. Look back
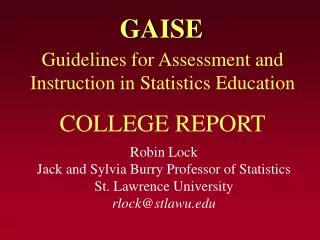
GAISEGuidelines for Assessment and Instruction in Statistics Education A Curriculum Framework for Pre-K-12 Statistics EducationThe American Statistical Associationwww.amstat.org/education/gaise/
Purpose of the GAISE Report • To provide a basic framework for informed K-12 stakeholders (writers of state standards, writers of assessment items, curriculum directors, pre K-12 teachers, educator at teacher preparation programs) that describes what is meant by a statistically literate high school graduate and to provide steps (levels) to achieve this goal. • To flesh out the NCTM Data Analysis and Probability Content Standard (as well as the five process standards). • To demonstrate that statistics is an investigative problem-solving process immersed in a context, and not a set of fancy tools and graphs and procedures for their own sake isolated from a context.
The GAISE Framework Developmental Levels A, B, Cfor evolving statistical concepts • The three levels roughly parallel PSSM’s preK-5, 6-8, and 9-12 grade bands. • However, the Framework levels are based on experience, not age. • Level A…learning is more teacher driven • Level B…learning becomes more student centered • Level C…learning is highly student driven • Hands-on, active learning is predominant throughout.
Distinction of Levels • All four steps of the statistical process are used at all three levels A, B, C. • The depth of understanding and sophistication of methods used increases across the levels. For example, a level A class may collect data to answer questions about their classroom; a level B class may collect data to answer questions about their school; and, a level C class may collect data to answer questions about their community and model the relationship between, say, housing prices and geographical variables such as the location of their schools.
Distinction of Levels • Use of Probability: • Level A impossible…equally likely…certain experimental and theoretical probability for coins/spinners • Level B concept of not equally likely; proportional reasoning; Binomial distribution • Level C use of simulation for sampling distributions to examine p-value
Distinction of Levels Mean: • Level A mean as fair share • Level B mean as a balancing point • Level C mean as an estimate from a sample that will be used to make an inference about a population – concept of sampling distribution
Distinction of Levels • What type of music is most popular among their peers in school? (rock, country, rap) • Level A Summarize frequencies in table or bar graph • Level B Transition to relative frequencies – proportional reasoning • Level C Transition to sampling distributions for a sample proportion and role of probability in finding a margin of error (of using sample proportion to estimate population proportion)
GAISE SUMMARY • Both conceptual understanding and procedural skills should be developed deliberately, but conceptual understanding should not be sacrificed for procedural proficiency. • Active learning in key to the development of conceptual understanding. • Real world data must be used wherever possible in statistics education. • Appropriate technology is essential in order to emphasize concepts over calculations.
CONCLUSION The ultimate goal of the Framework is to lay out a foundation for educational programs designed to help students achieve the noble goal of being a sound statistically literate citizen.