Download
1 / 12
120 likes | 216 Views
Individuals and Populations IB Stuff (kind of Chap. 45 & 46). Measuring populations. Animals Use the capture-mark-release-recapture method. Use the Lincoln index: N = n 1 n 2 / m 2 N = pop. est n 1 = # ind. captured, marked, and released n 2 = # ind. captured second time

E N D
Individuals and Populations IB Stuff (kind of Chap. 45 & 46)
Measuring populations Animals Use the capture-mark-release-recapture method. • Use theLincoln index:N = n1n2 / m2 • N = pop. est • n1 = # ind. captured, marked, and released • n2 = # ind. captured second time • m2 = # of (n) of marked ind. in second trapping
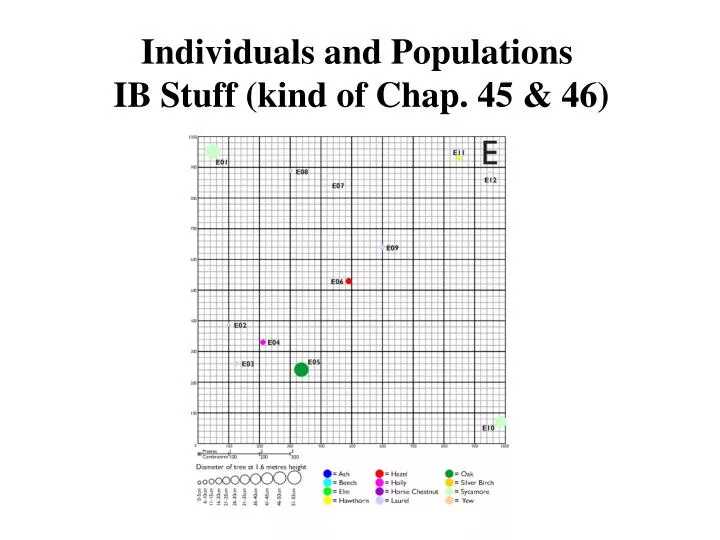
Plants Use random sampling that is based on random quadrats. (marked out sample squares) 1. Mark out grid lines on two axes 2. Generate two random numbers to use as coordinants and place one corner of your quadrat at this spot 3. Count individuals inside of the quadrat of the population being studied. Repeat steps 1 & 2 as many times as possible 4. Measure the total area occupied by the population in sq. meters.
5. Calculate the mean # of plants per quadrat then use following equation to estimate population size: pop. size = mean # plants per quad. ● total area area of each quadrat
A Population’s size The following affect the pop. size: • Natality – offspring added to the pop. • Mortality – ind. die and are lost from pop. • Immigration – ind. move into the pop. • Emigration – ind. move out of the pop.
Population Growth Exponential Growth (J-shaped curve) • in theory, all species have the capacity under ideal conditions
Logistic Growth (Sigmoid or S-shaped curve) • more realistic because the population stabilizes • at its carrying capacity (K) • affected by availability of nutrients, the number of predators, and the accumulation of waste materials
1. Exponential phase (lag and logphase in text) • natality is higher than the mortality • Unlimited population growth. Abundant food, no disease, no predators etc 2. Transitional phase (not in text) • natality rates start to fall and/or the mortality rate starts to rise • Limiting factors slowing population growth. 3. Plateau phase (saturation phase in text) • natality equals mortality so pop. is constant • No growth. The limiting factors balance the population’s capacity to increase.
Human Impact on Populations On a Global Scale - Greenhouse effect • gases (CO2, methane,…) in the atmosphere created by burning fossil fuels traps infrared radiation causing global warming • CO2 is 100ppm more now than in 1880 • global temperature has ↑ by several degrees over past decade, glacial deposits have melted across the globe, and the recent thinning of Artic and Antarctic ice packs • Global warming could increase 3C over the next 50 years • Could cause melting of glacier, flooding of low-lands, more frequent storms... • In order to reduce the greenhouse effect-- CO2 absorption by photosynthesis must go up and emissions from burning fossil fuels must go down.
Local scale -- Introduction of rats to Big South Cape Islandin New Zealand • Rats (Rattus rattus) were introduced to the island in 1950’s • Their numbers rose exponentially by 1960’s and three endemic bird species’ (wren, snipe, saddleback) eggs were eaten and the birds were not able to evade the rats, which resulted in wren and snipe becoming extinct. • Alien sp. should never be introduced to habitats containing endemic or rare sp. • Humans intervened by moving the saddleback to another island-- first ever by human intervention!?
Local scale -- Chinook salmon demise because of dams on the Kalamath River, OR. • dammed for electricity and drained for irrigation have pushed salmon into extinction, fishermen into bankruptcy and Indians into despair • massive fish kills, blooms of poisonous algae, diabetic Indians, fuming irrigators • low water flow as a result of irrigation and dams that block migrating salmon-- also make the river an unnaturally warm breeding ground for fish-killing bacteria and algae. • salmon runs have plummeted from historic highs of a million fish a year in the early 1900s to a prediction in 2006 of fewer than 30,000 • scientifically set minimum flows needed to protect migrating salmon • dams should either be removed or rebuilt in a hugely expensive way that allows fish passage