Download
1 / 22
220 likes | 345 Views
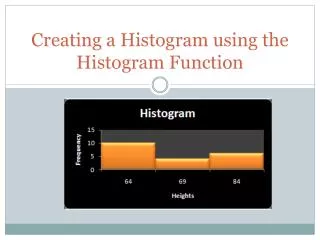
Histogram Whiteboard Activity. 4.18.12. Is the following a histogram?. Is the following a histogram?. What is wrong with the following histogram?. What is wrong with the following histogram?. Answers: No title Unequal intervals Intersecting intervals No labels

E N D
Histogram Whiteboard Activity 4.18.12
What is wrong with the following histogram? Answers: • No title • Unequal intervals • Intersecting intervals • No labels • Gaps between bars
Make a histogram! Before you begin… Ages of students taking Algebra 1: 14, 15, 11, 13, 13, 14, 12, 13, 13, 19, 13, 12, 14, 14, 13, 14, 11, 12, 15, 13 What is the first step?
Make a histogram! Organize your data! Sort the data from least to greatest! 11, 11, 12, 12, 12, 13, 13, 13, 13, 13, 13, 13, 14, 14, 14, 14, 14, 15, 15, 19 Give the mean, median, and mode. Mean: 13.4, Median: 13, Mode: 13 What is the range? Range: 8
Make a histogram! Organize your data! What’s a good interval to use? Make a frequency table with intervals of 3. Now create a histogram with the above table!
Make a histogram! Your histogram should look like:
Evaluating a histogram What are the intervals for this histogram? 2 How many students studied between 3 and 6 hours? 14 How many students studied for more than 5 hours? 7
Now it’s time for some… COMPETITION!!!
Evaluating a histogram What are the intervals for this histogram? How much data is less than ??? How much data is between ???
Evaluating a histogram What are the intervals for this histogram? 50 How many colleges got than 450? 43 How many colleges are between 600 and 800? 15
Evaluating a histogram What are the intervals for this histogram? 5 How many families spend less than $30? 35 What is the mode? Not enough information
Time for some… Comparison!
Compare and contrast: Hot Dogs Eaten in Contest Mode? Median? Make a Line Plot.
Compare and contrast: With… Your Line Plot!
Now it’s time for… …BOOKWORK!