Download
1 / 1

E N D
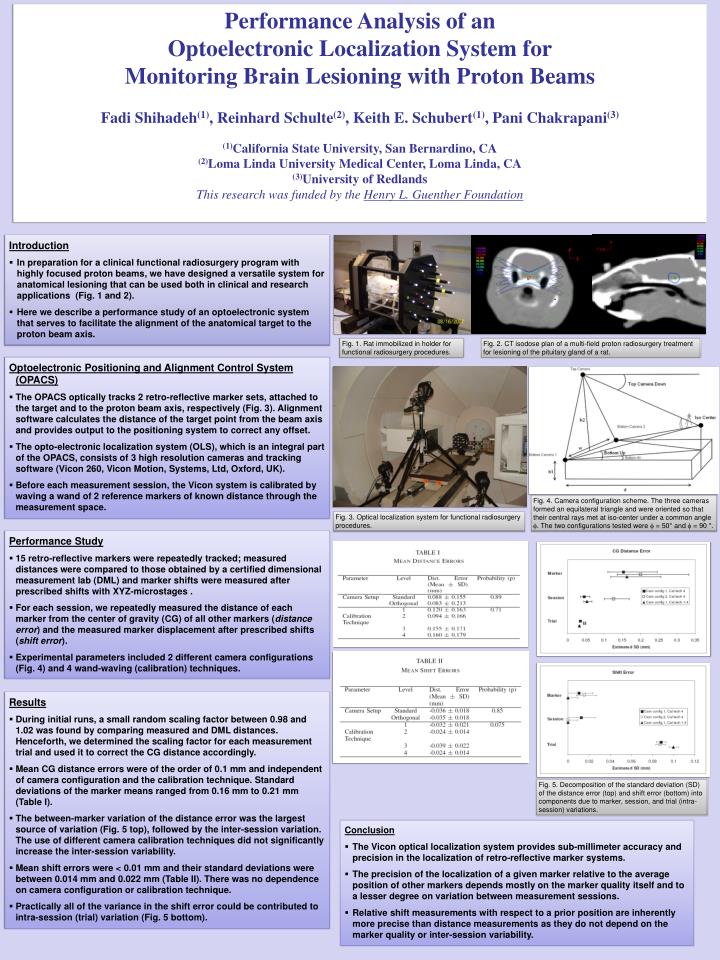
Performance Analysis of anOptoelectronic Localization System forMonitoring Brain Lesioning with Proton BeamsFadi Shihadeh(1), Reinhard Schulte(2), Keith E. Schubert(1), Pani Chakrapani(3)(1)California State University, San Bernardino, CA(2)Loma Linda University Medical Center, Loma Linda, CA(3)University of RedlandsThis research was funded by the Henry L. Guenther Foundation • Introduction • In preparation for a clinical functional radiosurgery program with highly focused proton beams, we have designed a versatile system for anatomical lesioning that can be used both in clinical and research applications (Fig. 1 and 2). • Here we describe a performance study of an optoelectronic system that serves to facilitate the alignment of the anatomical target to the proton beam axis. Fig. 1. Rat immobilized in holder for functional radiosurgery procedures. Fig. 2. CT isodose plan of a multi-field proton radiosurgery treatment for lesioning of the pituitary gland of a rat. • Optoelectronic Positioning and Alignment Control System (OPACS) • The OPACS optically tracks 2 retro-reflective marker sets, attached to the target and to the proton beam axis, respectively (Fig. 3). Alignment software calculates the distance of the target point from the beam axis and provides output to the positioning system to correct any offset. • The opto-electronic localization system (OLS), which is an integral part of the OPACS, consists of 3 high resolution cameras and tracking software (Vicon 260, Vicon Motion, Systems, Ltd, Oxford, UK). • Before each measurement session, the Vicon system is calibrated by waving a wand of 2 reference markers of known distance through the measurement space. Fig. 4. Camera configuration scheme. The three cameras formed an equilateral triangle and were oriented so that their central rays met at iso-center under a common angle f. The two configurations tested were f = 50° and f = 90 °. Fig. 3. Optical localization system for functional radiosurgery procedures. • Performance Study • 15 retro-reflective markers were repeatedly tracked; measured distances were compared to those obtained by a certified dimensional measurement lab (DML) and marker shifts were measured after prescribed shifts with XYZ-microstages . • For each session, we repeatedly measured the distance of each marker from the center of gravity (CG) of all other markers (distance error) and the measured marker displacement after prescribed shifts (shift error). • Experimental parameters included 2 different camera configurations (Fig. 4) and 4 wand-waving (calibration) techniques. • Results • During initial runs, a small random scaling factor between 0.98 and 1.02 was found by comparing measured and DML distances. Henceforth, we determined the scaling factor for each measurement trial and used it to correct the CG distance accordingly. • Mean CG distance errors were of the order of 0.1 mm and independent of camera configuration and the calibration technique. Standard deviations of the marker means ranged from 0.16 mm to 0.21 mm (Table I). • The between-marker variation of the distance error was the largest source of variation (Fig. 5 top), followed by the inter-session variation. The use of different camera calibration techniques did not significantly increase the inter-session variability. • Mean shift errors were < 0.01 mm and their standard deviations were between 0.014 mm and 0.022 mm (Table II). There was no dependence on camera configuration or calibration technique. • Practically all of the variance in the shift error could be contributed to intra-session (trial) variation (Fig. 5 bottom). Fig. 5. Decomposition of the standard deviation (SD) of the distance error (top) and shift error (bottom) into components due to marker, session, and trial (intra-session) variations. • Conclusion • The Vicon optical localization system provides sub-millimeter accuracy and precision in the localization of retro-reflective marker systems. • The precision of the localization of a given marker relative to the average position of other markers depends mostly on the marker quality itself and to a lesser degree on variation between measurement sessions. • Relative shift measurements with respect to a prior position are inherently more precise than distance measurements as they do not depend on the marker quality or inter-session variability.