Download
1 / 39
390 likes | 507 Views
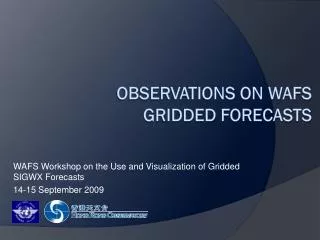
MeteoExpert workstation. Visualization of new gridded forecasts. Tatiana Bazlova, Institute of Radar Meteorology St. – Petersburg, Russia. WAFS Workshop, Paris, 1 4- 1 5 September, 2009. IRAM: key features. Key Figures. Foundation - 1991

E N D
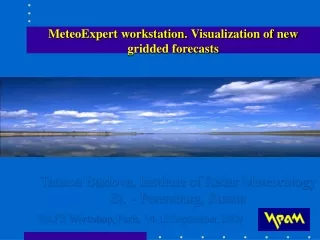
MeteoExpert workstation.Visualization of new gridded forecasts Tatiana Bazlova, Institute of Radar Meteorology St. – Petersburg, Russia WAFS Workshop,Paris, 14-15 September, 2009
IRAM: key features Key Figures • Foundation - 1991 • Employees: ~ 50 staff, mainly engineers and meteorologists, 6 doctors of science & PhDs • ISO 9001-2001 Certificate • Own facilities • Own Production, Training and Test Ranges Resources Clients • Aviation and Air Traffic Control • Meteorological Centers and Service Providers • Road Authorities
IRAM: Main fields of application • Aviation • Meteorological radar observation network • Surface observation network • Motor transport • Total number of installations: >800 in 10 countries • Systems are in operational use at 85 airports
Meteorological provision of air navigation • AWOS • Telecommunication system • Forecaster’s workstation • Briefing workstation • SADIS 2G workstation (the software passed all the Met Office tests in 2004 – 2009) • Weather radar system • RWIS for runways Systems Services • Installation • Training • Maintenance • Modernization, Upgrades
New gridded WAFS forecasts • Forecasts for icing, turbulence and CB clouds(ICE/TURB/CB) in the GRIB code form • Available via SADIS FTP • Improvement in the temporal and space resolution - from 6 to 3 hour (Т+6, Т+9, …, Т+36) - additional levels around jet stream (FL320,360) • Greater detail in comparison with the existing SIGWX forecasts • Recommended time period for use ±1 hour 30 min • Implementation in 2010 (Amendment 75 to Annex 3)
Settings • Area • Element • Level • Center • Lead time • Data time • View mode
Icing (ICE) thinned GRIB data • A measure of the likelihood of encountering icing conditions all over the globe • Mean Icing Potential – mean value within a gridbox • Maximum Icing Potential- maximum value within a gridbox • At5 levels – 700, 600, 500, 400, and 300 hPa (vertical interval of 100hPa)
МeаnIcing Potential FL 180 VALID 00 UTC 25.02.2009 BASED ON 12 UTC DATA ON 24.02.2009 Moderate and severe values are to be indicated in yellow and red
МахimumIcing Potential FL 180 VALID 00 UTC 25.02.2009 BASED ON 12 UTC DATA ON 24.02.2009
TURB thinned GRIB data • In-Cloud Turbulence Potential - a measure of the likelihood of encountering turbulence in layer cloud • Mean In-Cloud Turbulence Potential – the mean value within a gridbox • Maximum In-Cloud Turbulence Potential – the maximum value within a gridbox • At 5 levels - 700, 600, 500, 400, and 300 hPa
МeаnIn-Cloud Turbulence FL 100 VALID 12 UTC 24.02.2009 BASED ON 12 UTC DATA ON 24.02.2009 Yellow and red colours correspond to moderate and severe values
МахimumIn-Cloud Turbulence Standard qualifiers for description of moderate and severe turbulence are indicated by the color scale Relations should be set between standard terms and qualifiers used to describe ICE/TURB/CB in gridded forecasts (calibration issue)
TURB thinned GRIB data • CAT Potential - a measure of the likelihood of encountering moderate or severe clear air turbulence per 100km of route flown • Mean CAT Potential - the mean value within a gridbox • Maximum CAT Potential - the maximum value within a gridbox • At 5 levels – 400, 300, 250, 200,and 150 гПа.
МeаnCAT Potential FL 300 VALID 12 UTC 24.02.2009 BASED ON 06 UTC DATA ON 24.02.2009
МахimumCAT Potential FL 300 VALID 12 UTC 24.02.2009 BASED ON 06 UTC DATA ON 24.02.2009
CB cloud GRIB data • CB forecasts – convective cloud forecasts all over the globe • CB horizontal extent – the horizontal coverage of CB within a grid box at all levels • Pressure at CB base and at CB top, • Pressure at Embedded CB base and at Embedded CB top • ICAO height at CB base and at CB top • ICAO height at Embedded CB base and at Embedded CB top
CB Horizontal Extent CB COVER, % VALID 18 UTC 24.02.2009 BASED ON 12 UTC DATA ON 24.02.2009 All values are shown in yellow to red colours
Pressure at CB base, hPa VALID 18 UTC 24.02.2009 BASED ON 12 UTC DATA ON 24.02.2009 All values are shown in digital form
Pressure at CB top, hPa VALID 18 UTC 25.02.2009 BASED ON 12 UTC DATA ON 24.02.2009
Height at CB top, kft VALID 18 UTC 24.02.2009 BASED ON 12 UTC DATA ON 24.02.2009 For verification can be compared with radar data
Integrated data for ICE/TURB/CB • It should be clear for the user how to interpret new data. Each of ICE/TURB should be characterized by single parameter. Thresholds (light, moderate and severe) need to be determined. • Integrated ICE/TURB/CB data is displayed as hazard contours – the most useful information for users. • Hazard zones are found out where ICE and/or TURB and/or CB values exceed the corresponding thresholds.
Hazard contours Hazard contours (in red) indicate zones where ICE and/or TURB and/or CB values exceed the corresponding severe thresholds It seems to be most simple and informative alternative of ICE/TURB/CB visualization for users
Concatenated forecasts for long-haul flights • ICAO Annex 3 is to be developed to enable the provision of concatenated route-specific forecasts (WAFSOPSG/4) • Concatenated WIND/TEMPERATURE forecastscan be displayed at a composite chart (Т+12, Т+18, Т+24) • ConcatenatedICE/TURB/CBforecastscan be displayed at a composite chart (Т+12, Т+18, Т+24)
Wind+Tcomposite (West->East) FL 100 VALID00 UTC 25.02.2009 06 UTC 25.02.2009 12 UTC 25.02.2009
Wind+Tcomposite (East->West) FL 100 VALID12 UTC 25.02.2009 06 UTC 25.02.2009 00 UTC 25.02.2009
Wind+Tcomposite (North->South) FL 180 Valid00 UTC 25.02.2009 Valid06 UTC 25.02.2009 Valid12 UTC25.02.2009
WIND+T composite (South->North) FL 340 Valid12 UTC 25.02.2009 Valid06 UTC 25.02.2009 Valid00 UTC25.02.2009
Max TURB composite (West->East) FL 140 VALID18 UTC 24.02.2009 00 UTC 25.02.2009 06 UTC 25.02.2009
Max In-Cloud TURB composite (North->South) FL 180 Valid 00 UTC 25.02.2009 Valid 06 UTC 25.02.2009 Valid 12 UTC25.02.2009
Max CAT composite (East->West) FL 140 VALID 12 UTC 25.02.2009 06 UTC 25.02.2009 00 UTC 25.02.2009
Max Icing composite (South->North) FL180 VALID 06 UTC 25.02.2009 VALID 00 UTC 25.02.2009 VALID 18 UTC 24.02.2009
CB cover composite(West->East) FL140 VALID 18 UTC 24.02.2009 00 UTC 25.02.2009 06 UTC 25.02.2009
SIGWX composite (South->North) BUFR encoded data VALID 18 UTC 13.04.2009 VALID 12 UTC 13.04.2009 VALID 06 UTC 13.04.2009 FL 250 - 630
Support for issuance of SIGMETs • Meteorological Watch Office (MWO) makes use of products of WAFCs and other sources • High resolution mesoscale models are needed to forecast hazardous phenomena for regions of MWO responsibility (ex., the WRF model with 3 km resolution, 1.5km grid length version of the Met Office Unified Model)
Mesoscale model (WRF-ARW). Cloud water • Horizontal resolution - 3km x 3km • Time resolution – 1 hour • Domain – ~1000 km x 1000 km • Level – 925 hPa • Valid 06 UTC 12.08.2009
AMDARdata for verification • WMO aircraft meteorological data relay (AMDAR) reports include turbulence data • AMDAR code provides for identification of turbulence in terms of light, moderate and severe turbulence • AMDAR data is to be displayed at standard FLs and compared to GRIB encoded data for turbulence.
AMDARdata: Wind/Temp/Turb at FLs FL390 VALID 17:30 UTC 06.10.2008
Conclusions • It is desirable to get model outputs in terms of physical atmospheric properties (ex. EDR) . Each of ICE/TURB should be characterized by single parameter (instead of MEAN and MAX). • The relations should be set between standard terms and qualifiers used to describe ICE/TURB/CB in gridded forecasts. Thresholds for description of moderate and severe ICE/TURB/CB should beestablished. • ConcatenatedICE/TURB/CBforecastsfor long-haul flight can be displayed on a composite chart. • It seems useful to combine corresponding data for ICE, TURB and CB and display it on a chart as hazard countours.
Thank you expert@iram.ru iram@iram.ru