Download
1 / 28
430 likes | 860 Views
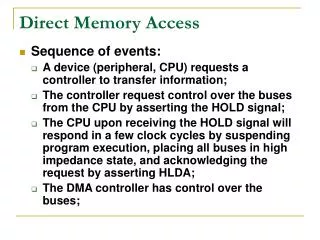
Memory Access Cycle and the Measurement of Memory Systems. Xian-He Sun Dawei Wang November 2011. Memory Wall Problem. Processor-DRAM Memory Gap. µProc 1.20/yr. “Moore’s Law”. µProc 1.52/yr . (2X/1.5yr). DRAM 7 %/ yr. (2X/10 yrs). Processor-Memory

E N D
Memory Access Cycle and the Measurement of Memory Systems Xian-He Sun Dawei Wang November 2011
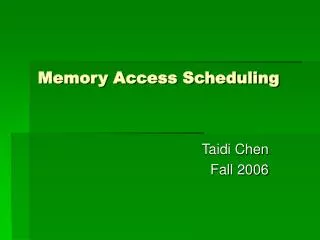
Memory Wall Problem Processor-DRAM Memory Gap µProc 1.20/yr. “Moore’s Law” µProc 1.52/yr. (2X/1.5yr) DRAM 7%/yr. (2X/10 yrs) Processor-Memory Performance Gap:(grows 50% / year) • 1980:no cache in micro-processor; 2010: 3-level cache on chip, 4-level cache off chip • 1989 the first Intel processor with on-chip L1 cache was Intel 486, 8KB size • 1995 the first Intel processor with on-chip L2 cache was Intel Pentium Pro, 256KB size • 2003thefirstIntel processor with on-chip L3 cache was Intel Itanium 2, 6MB size Source: Computer Architecture A Quantitative Approach
Extremely Unbalanced Operation Latency IO Access 5~15M cycles Cycles
Source: NaSt3DGP Source: Multi-grid solver Source: MPQC Source: Gromacs Data Access becomes THE Bottleneck • Applications become data intensive • Animation and Visualization applications • Data mining, information retrieval • Geographic information system, etc • Scientific and engineering simulation • Need a better understanding of memory system performance • Need a new performance metric for memory systems
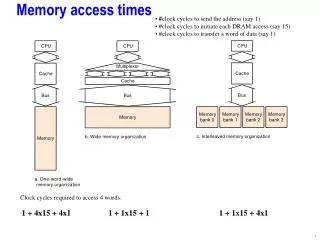
Capacity Access Time, Bandwidth UpperLevel Staging Xfer Unit faster CPU Registers <8KB <0.2~0.5 ns, 500~800 GB/s/core Registers prog./compiler 1-8 bytes Instr. Operands Cache <50MB 1-10 ns, 50~150GB/s/core Cache cache cntl 32-128 bytes Blocks Main Memory Giga Bytes 50ns-100ns 5~10GB/s/channel Memory OS 4K-4M bytes Pages Disk Tera Bytes, 5 ms 100~300MB/s Disk user/operator Mbytes Files Larger Tape Peta Bytes or infinite sec-min Tape LowerLevel Complexity of Memory Hierarchy
Complexity of Data Access • The complexity of CPU Design • Out-of-order Execution • Multithreading technology • Speculation mechanisms • The complexity of Memory Design • Advanced Cache Technologies • Allow tens or hundreds of cache accesses to overlap with each other • Processor continue execution instructions under multiple cache misses
Existing Memory Metrics • Miss Rate(MR) • {the number of miss memory accesses} over {the number of total memory accesses} • Misses Per Kilo-Instructions(MPKI) • {the number of miss memory accesses} over {the number of total committed Instructions × 1000} • Average Miss Penalty(AMP) • {the summary of single miss latency} over {the number of miss memory accesses} • Average Memory Access Time (AMAT) • AMAT = Hit time + MR×AMP • Flaw of Existing Metrics • Focus on a single component or • A single memory access
Measure Memory Performance: TheRequirements • Separate but closely related to CPU performance • Not Flop or IPC, but a major factor • Provide the total performance of the memory system as well as the performance of each tier of the memory hierarchy • Cover the complexity of modern memory systems • Simple, easy to use, and easy to understand
The Introduction of APC • Access Per Cycle (APC) • APC is measured as the number of memory accesses per cycle • Measures the overall memory system performance • Each memory level has its own APC value • Dominating overall CPU performance • Benefits of APC • Separate memory evaluation from CPU evaluation • A better understanding of memory system as a whole • A better understanding of the match between computing capacity and memory system performance
APC in Detail • APC is the overall memory accesses requested at a certain memory level (i.e. L1, L2, L3, Main Memory) divided by the total number of memory access cycles at that level • APC = M/T • Different level has different APC • APCD L1 Data Cache • APCI L1 Instruction Cache • APCM Main Memory • APC performance is hierarchical
APC Measurement • The difficulty is measuring the total cycle T • Hundreds of memory accesses co-exist the memory system • Measure T based on the overlapping mode • When there are several memory accesses co-existing during the same clock cycle, T only increases by one • Measure the concurrence • Measure the concurrence at each level
APC Measure Logic (AML) • Detects memory access activities from MSHR, cache and CPU • If one active, Cycle ++ • Hardware cost analyze • CPU/Cache interface detecting logic<=bit-width of the command and data buses • Cache detecting logic = length of the pipeline stage of cache access • MSHR table empty status, 1bit • Total less than 1K bits
APCM Measurement • Last Level Cache Measurement • DRAM Accesses Count • LLC MSHR Cycles • APCM = DRAM Accesses Count / LLC MSHR Cycles • Hardware cost • DRAM Access Count usually provided by CPU performance counters • LLC MSHR Cycles only need 1 bit to detect MSHR empty or not • Available on some microprocessors
Validation Testing Methodology • System performance is the ultimate interest • A good memory metric should influence system performance directly • Use IPC (Instruction Per Cycle) as the system performance • Use Correlation Coefficient to measure the correlation • Better correlation, better metric
Correlation Coefficient • Correlation coefficient (CC) describes the proximity between two variables changing trends from a statistics viewpoint. • It measures how well two variables match with each other
Experiment Environment • Detailed out-of-order Alpha 21264-like CPU model in the M5 simulator • Superscalar: out-of-order, speculation, 8-issue • Private split L1 caches + Shared L2 cache • Non-blocking cache, pipelined cache, cache prefetching • Single core & Multi-core • Simulate a serial of configurations with changing one or two memory parameters • Spec CPU2006, 26 benchmarks, 1B instructions • Test on different configurations & benchmarks
APC and IPC with Different Applications • APC has the strongest relation with IPC (CC = 0.871) • AMAT is the second best with average CC value of -0.670 • APC improves correlation value by 30.0% • HR has almost the same correlation value with AMAT
Experiments Results • APC has the highest correlation coefficient value with IPC, the average value for all application is 0.9632 • APC and IPC has a directly dominant relationship • AMAT has the second highest correlation with IPC, with an average value of -0.9393 • AMAT is a pretty good metric in reflecting memory performance variation without considering Non-blocking cache optimization • For other metrics, there are some misleading indications
APC & IPC: Changing Cache Parallelism • Changing the number of MSHR entries (121016) • APC still has the dominant correlation, with average value of 0.9656 • AMAT does not correlate with IPC for most applications • APC record the CPU blocked cycles by MSHR cycles • AMAT cannot records block cycles, it only measure the issued memory requests
Exhausted Testing • With different benchmarks, and with different configurations • With advanced cache technologies • Non-block cache • Pipelined cache • Multi-port cache • Hardware prefetcher • With single core or multicore • APC always has the highest CC values among all the memory metrics
APC Applications Find the lowest level that has a dominating correlation with IPC Find the contribution of concurrence Quantitatively define data intensiveness Provide a mean to study the matching between memory organization and microprocessor architecture, Provide a mean to study the matching between memory organization and a given application
A Definition of Data Intensiveness Definition coe(APCM, IPC) ≥ 0.9 • The IPC and APC correlation value provides a quantitative definition of data intensive • Use the correlation value of APCM to quantify the degree of data intensive • Do not count data re-use as part of data-intensiveness unless it has to be read from main memory again • Assuming the "memory-wall" problem is actually due to the slow speed of main memory • Could define differently for small kernel application or off-core application
Data-intensive Definition • The correlation value of APCM are divided into three intervals, that is (-1, 0.3), [0.3, 0.9), [0.9, 1) • Reason for picking 0.9 as the threshold According to mathematical definition of correlation coefficient When CC >= 0.9, then the two variables have a dominant relation
Related Work • Traditional Memory Metrics • Miss Rate (MR), Miss Per Kilo-Instructions (MPKI), • Average Miss Penalty (AMP), Average Memory Access Time (AMAT) • Memory Level Parallelism (MLP) • Average number of long-latency main memory outstanding accesses when there is at least one such outstanding access • Assuming each off-chip memory access has a constant latency, say m cycles, APCM=MLP/m • That means APCM is directly proportional to MLP • APC is superset of MLP
Conclusion • Contribution • Proposed new memory metric APC • APC links memory performance to CPU performance • APC links the performance of each tier of a memory hierarchy together • Future Work • Extend to file system APCIO • Extend to network environment APCNet • Measure APCM , APCIO , and APCNet • Use APC to analyze the bottleneck of data-centric algorithms