Download
1 / 24
240 likes | 544 Views
Chapter 13 Marine Resources. --Oceans and inland waters cover more than 2/3 of the surface of Earth

E N D
Chapter 13 Marine Resources --Oceans and inland waters cover more than 2/3 of the surface of Earth --This aquatic ecosystem provides products and services: commercial and recreational fishing; transportation services; shore-based and offshore recreation activities; atmospheric and climate control, and mineral supplies
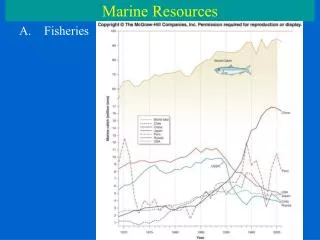
Some Facts • Figure 13-1, p.240: the total commercial fish harvest in the world (and in the U.S.) over the last few decades has increased • No. 1 U.S. finfish by value is salmon; No. 1 U.S. shellfish by value is sea scallops • In North America only about 7% of animal protein intake comes from fish; in Africa, it is 21%; in southeast Asia, it is 28% • As some of the higher-value species (cod…) have become more scarce, much of the growth in harvest has been accounted for by lesser-valued species (sardines…)
1. Categories of Marine Resources • Physical resources include petroleum and natural gas, which form from the buried remains of marine plankton. This category also includes many other kinds of minerals, as well as fresh water extracted from seawater by desalination • Other energy resources include several methods of generating electrical power from waves and currents, wind, tides, and thermal gradients in the oceans • Biological resources are marine animals and plants harvested for food and other uses. The commercial fishing industry has fished many commercial fish stocks beyond their maximum sustainable yield • Nonextractiveresources include use of the oceans for transportation and recreation
Biological Resources • Biological resources represent all the animals and plants that we harvest from the sea, primarily for food • Marine sources of food provide a significant proportion of the human population’s protein intake. Fish, crustaceans, and mollusks constitute the majority of the world’s commercial marine harvest
Biological Resources • Major types of commercially harvested • fish, mollusks, and crustaceans. Major types of commercially harvested fish, crustaceans, and mollusks
Biological Resources • Commercial fishing is a multibillion dollar industry, and is the most dangerous job in the U.S., having the highest death rate of any profession!
Biological Resources • A stern trawler net with Statue of Liberty for scale. Some trawler nets can hold a dozen 747s! Slides 3-8 and 10-12: http://scidiv.bellevuecollege.edu/gj/Ocean101-Ch15-Resources.pdf
2. Current Problems in Marine Fisheries • Excessive harvesting of many commercial fish stocks means that today we may be close to the catastrophic collapse of many fisheries • Some problems relating to fishery management: • Overfishing–a status assigned to fish stocks that have been harvested so thoroughly that there are not enough individuals left to provide breeding stock to replenish the species • Overcapitalization—excessive investments in national fishing fleets • Commercial extinction–the depletion of a species to the point where it is no longer profitable to harvest • By-kill–animals unintentionally killed when other species are being harvested during commercial fishing • Water pollution that threatens the health of some species • Conflicts over fishing rights both intercountry and intracountry
By-Kill • By-kill refers to animals unintentionally killed during commercial fishing. Tremendous amounts of by-kill occur during many fishing operations. One of the main causes of by-kill are drift nets: large, vertically suspended floating nets that snare nearly anything that runs into them. Turtles, seals, dolphins, and many noncommercial fish species are killed by the thousands in these nets each year
3. Modeling a Fishery • A fishery: a collection of fish that inhabit a reasonably well delimited section of marine habitat • We measure the fish stock in biomass—the aggregate weight of all the individuals • Two major natural growth factors: reproduction; maturation • Two forces working in the opposite direction: losses from predation and food scarcities; losses from natural mortality especially old age
The Logistic Model of Population Growth for a Fishery Figure 13-3, p.245 • Horizontal axis—the size of the biomass; vertical axis—change in biomass during a period of time • The inverted U-shaped function starts at the origin—no fish, no increment • At higher stocks, the increment is larger, reaching a maximum at a stock size of s1 • At s0, the different factors are all in balance, so there is no increment • Beyond s0 , increment is negative; biomass decreases
Yield: a certain amount of the biomass harvested and removed each year • Any stock size is sustainable if the yield matches the natural increment in the biomass (y2 pounds at s2); stock size would be unchanged
The Effort-Yield Curve • Harvesting effort—the economic resource devoted to catching fish; includes capital goods (boats and gear), labor, materials, and energy • Yield is sustained yield (= the natural increment in the biomass) • Origin: stock size is s0, increment is 0, effort is 0 • As effort increases, yield increases; at an effort level of em, yield reaches its maximum point • At still higher effort levels, stock levels become reduced; at a very high effort level, stock is 0 Figure 13-4, p.246
An effort level of em produces the maximum sustainable yield (MSY) from this fishery • MSY • the maximum biological yield that the fishery is capable of producing • the maximum quantity of harvest that can be realized in the long run • often regarded as the best target to aim for in exploiting renewable resources • new name: long-term potential yield
Efficient Rates of Effort • Net benefits = total revenue – total cost • Total revenue = yield * price • Total cost = cost per unit of effort * effort • Net benefits are maximized at e* • Maximum net benefits = r1 – r2 • Net benefits at emare lower than at e* • At em, yield is higher, the extra costs are even greater, so net benefits are lower Figure 13-5, p.248
4. The Problem of Open Access • Open-access rule: anybody who has wanted to buy a boat and go fishing had the right to do so • At e*, there are profits to be made by any individual entering the fishery • This incentive continues to exist until total effort has grown to e0 (p.248) where total revenue = total cost • The open-access condition has produced higher effort levels and smaller stock levels than is socially efficient; there are too many fishers exploiting a fishery
5. Approaches to Fisheries Management a. Restricting Access • Territorial use rights in fisheries (TURFs) have been recognized around particular geographical areas that make it possible to set boundaries and exclude would-be encroachers (eg., the harbor gangs of Maine)—the logic is exclusion of outsiders
b. Regulating Fishing Practices • The dominant approach in fishery regulation has been command-and-control (CAC) types of restrictions on fishing practices: closing certain areas, restricting the size of boats… • Figure 13-6, p.251 • CAC raises the cost of fishing (restricting the type of net that may be used makes it more costly to catch a given quantity of fish) • Original total cost curve TC1 shifts to TC2 or TC3; now open access, instead of leading to e0, produces only em or e3 units of effort
Problems • Although it is possible to reduce effort levels and increase stock, it makes fishing much more costly • This type of direct control can never be complete; when some parts of the fishing enterprise are constrained, fishers attempt to expand in uncontrolled directions
c. Catch Limits • Authorities establish upper limits on the quantity of fish that may be taken from particular fisheries—total allowable catch (TACs) or total catch quotas • Problem: derby fishery—fishers have incentive to do whatever it takes (bigger boats, nets…) to get bigger shares of the TAC before the fishery is closed down when the limit is reached
d. Individual Transferable Quotas (ITQs) • Setting TACs and then dividing them up into quotas for individual fishers will reduce the incentive for a “race to fish” • Divide individual quotas to be bought and sold, and keep track of who owns how many • Fishers cannot harvest and sell quantities of fish in excess of their quota holdings • Monitor the performance of the ITQ market to spot and manage problems related to concentrated ownership, community impacts, and biological uncertainties