Download
1 / 7
70 likes | 155 Views
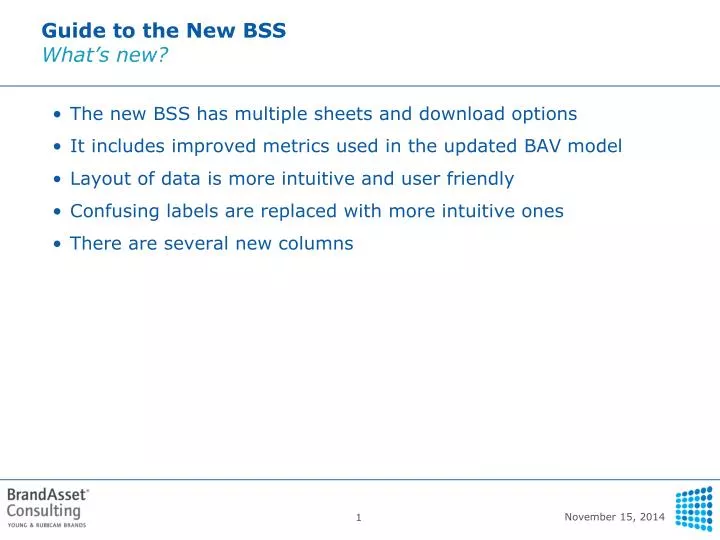
Guide to the New BSS What’s new?. The new BSS has multiple sheets and download options It includes improved metrics used in the updated BAV model Layout of data is more intuitive and user friendly Confusing labels are replaced with more intuitive ones There are several new columns.

E N D
Guide to the New BSSWhat’s new? • The new BSS has multiple sheets and download options • It includes improved metrics used in the updated BAV model • Layout of data is more intuitive and user friendly • Confusing labels are replaced with more intuitive ones • There are several new columns
The New BSS has multiple sheetsYou can either download the whole BSS, or just its first sheet Each BSS now has 3 sheets. • The first sheet contains all basic BAV metrics: strength, stature, pillars, attributes, usage and consideration numbers, global factor scores and loyalty measures • The second sheet contains • metrics we no longer use • Strength, stature, and pillar scores for the original 4 pillar and the energized 5 pillar model • Attribute scores for attributes we no longer track (e.g. Honest, Strong, Eco-Friendly) • Percent of respondents belonging to four loyalty groups • Distribution of Knowledge, Relevance and Regard scores • The third sheet contains base definition and study info IMPORTANT: If you want older versions of the BAV Model (5 Pillars, or the original 4 Pillar, you need to download the whole BSS, not just the first sheet)
New BSS includes improved metrics BAV model Evolution • 1.0 (launched in 1993) • The Original 4 Pillar Model • DIFFERENTIATION • Different • Distinctive • Unique • RELEVANCE • Old ESTEEM • Regard scalar • Best Brand • KNOWLEDGE • Old BRAND STRENGTH • Differentiation, Relevance • Old BRAND STATURE • Old Esteem, Knowledge • 2.0 (launched in 2006) • Energized 5 Pillar Model • DIFFERENTIATION • Different • Distinctive • Unique • ENERGY • Dynamic • Innovative • RELEVANCE • ESTEEM • Regard scalar • Leader, Reliable, High Quality • KNOWLEDGE • ENERGIZED BRAND STRENGTH • Differentiation, Energy, Relevance • BRAND STATURE • Esteem, Knowledge • 3.0 (launched in 2008) • New 4 Pillar Model • ENERGIZED DIFFERENTIATION • Different • Distinctive • Unique • Dynamic • Innovative • RELEVANCE • ESTEEM • Regard scalar • Leader, Reliable, High Quality • KNOWLEDGE • BRAND STRENGTH • Energized Differentiation, Relevance • BRAND STATURE • Esteem, Knowledge
Layout of data is more intuitive and user friendly • The pillars are now grouped together in a logical order (Energized Differentiation, Relevance, Esteem, Knowledge) • Attributes are ordered in the following way • Components of Energized Differentiation • Attribute components of Esteem • All other attributes follow in alphabetical order • First Sheet contains • Brand Info (id, category sector) • Brand base size (weighted and unweighted) • Pillar rank scores (_R) • Stature and strength rank scores (_R) • Usage/Preference Base (number of respondents who were exposed to usage section for the brand) • Usage and Consideration numbers • Pillar construct scores (_C) • Stature and strength construct scores (_C) • Attribute raw scores (_pct) • Attribute rank scores (_R) • Differentiation and Energy construct scores (_C) • Differentiation and Energy rank scores (_R) • Global Factor rank scores (_R) • Global Factor construct scores (_C) • Diagnostic Base (number of respondents who were exposed to loyalty section for the brand) • Loyalty attributes (_pct) • Loyalty factors (Community, Product, Treatment) (_C) • Top of Mind and Total Unaided numbers (_pct) • Study Year and Country, Base, Brand and Category info
Layout of data is more intuitive and user friendly • Second Sheet contains • Brand Info (id, category sector) • Brand base size (weighted and unweighted) • Energized 5 pillar model (2.0) pillar rank scores (_R) • Energized 5 pillar model (2.0) energized strength and stature rank scores (_R) • Energized 5 pillar model (2.0) pillar construct scores (_C) • Energized 5 pillar model (2.0) energized strength and stature construct scores (_C) • Original 4 pillar model (1.0) pillar rank scores (_R) • Original 4 pillar model (1.0) old strength and old stature rank scores (_R) • Original 4 pillar model (1.0) pillar construct scores (_C) • Original 4 pillar model (1.0) old strength and old stature construct scores (_C) • Raw (_pct) and rank (_R) attribute scores for Calm, Community Minded, Eco-Friendly, Honest, Outdoorsy, Strong and Tough • Relevance mean score (_MS) • Relevance 1_7, 2_7, 3_7, 4_7, 5_7, 6_7, and 7 (where Relevance 3_7 represents the percent of people who saw the brand and gave it a relevance score of 3 or higher) • Regard mean score (_MS) • Regard 1_7, 2_7, 3_7, 4_7, 5_7, 6_7, and 7 • Knowledge mean score (_MS) • Knowledge 2_7, 3_7, 4_7, 5_7, 6_7, and 7 • Would Consider (_pct) • Loyalty base • Loyalty groups • Third Sheet contains • Base Name • Base Definition • Ranked Against • Unweighted respondent count • Weighted respondent count • BSS Number of unique brands • Study Info: Country • Study Info: Period • Study Info: Field Dates • Study Info: Number of categories • Study Info: Number of Cells • Study Info: Number of unique brands • Study Info: Weighted number of respondents • Study Info: Unweighted number of respondents
Confusing labels are replaced with more intuitive ones • Usage metrics are now labeled after the concepts they represent • Use_Regularly_Use_pct – percent of people who regularly use or own/lease the brand (formerly Use_1) • Use_Occasionally_pct – percent of people who use the brand occasionally (formerly Use_2). In some categories, like automobiles, this classification is not meaningful and is therefore omitted. • Lapsed_User_pct – depending on category, percent of people who used to use the brand, but do not use it anymore OR percent of people who use the brand only when there is no convenient alternative (formerly Use_3). • Never_Used_pct (formerly was Use_4) • Consideration metrics are now labeled after the concepts they represent • One_I_Prefer_pct – formerly Consider_4 • One_of_several_pct – formerly Consider_3 • Only_if_no_alternative_pct – formerly Consider_2 • Would_never_consider_pct - formerly was Consider_1
New columns • Usage/Preference Brand Base – represents the total number of respondents who were exposed to usage/consideration section for the brand • Total_Users_pct – percent of respondents who use the brand regularly or occasionally • Total_Prefer_pct - percent of respondents who say that the brand is the only one they prefer or one of several they prefer • Eight global factors – are developed on recent global data and replace the former 9 global factors • Relevance/Regard 1_7, 2_7, 3_7, 4_7, 5_7, 6_7, and 7 - represents the percent of people who saw the brand and gave it a relevance/regard score of x or higher