Download
1 / 1
10 likes | 97 Views
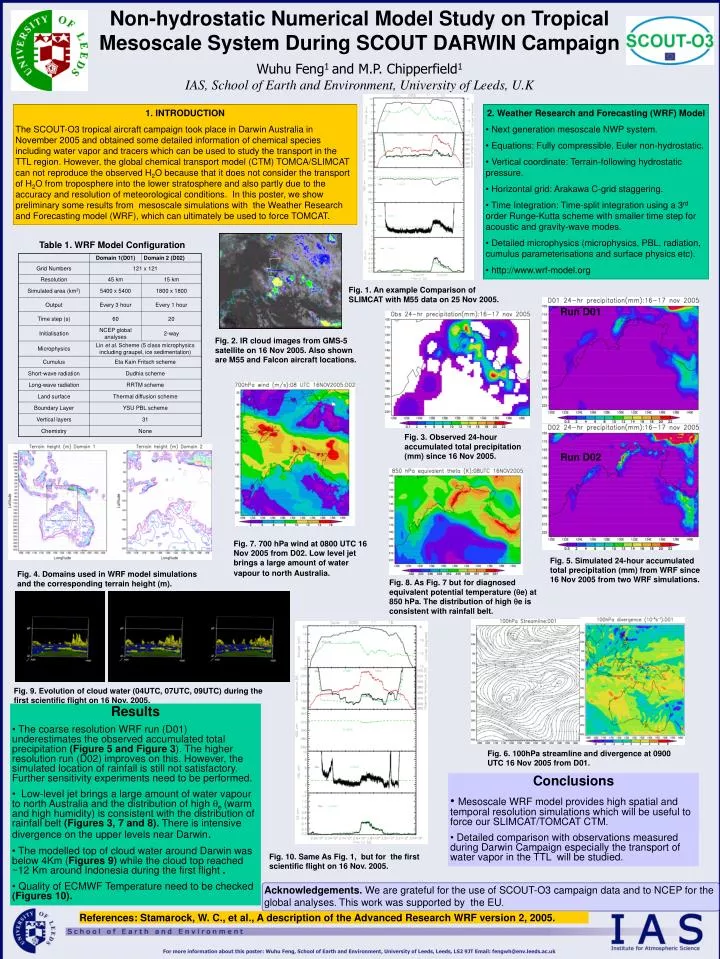
Non-hydrostatic Numerical Model Study on Tropical Mesoscale System During SCOUT DARWIN Campaign. Wuhu Feng 1 and M.P. Chipperfield 1 IAS, School of Earth and Environment, University of Leeds, U.K. 1. INTRODUCTION

E N D
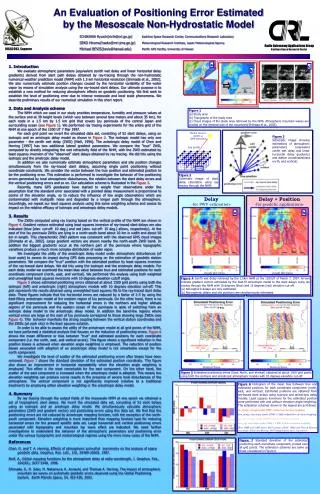
Non-hydrostatic Numerical Model Study on Tropical Mesoscale System During SCOUT DARWIN Campaign Wuhu Feng1 and M.P. Chipperfield1 IAS, School of Earth and Environment, University of Leeds, U.K 1. INTRODUCTION The SCOUT-O3 tropical aircraft campaign took place in Darwin Australia in November 2005 and obtained some detailed information of chemical species including water vapor and tracers which can be used to study the transport in the TTL region. However, the global chemical transport model (CTM) TOMCA/SLIMCAT can not reproduce the observed H2O because that it does not consider the transport of H2O from troposphere into the lower stratosphere and also partly due to the accuracy and resolution of meteorological conditions. In this poster, we show preliminary some results from mesoscale simulations with the Weather Research and Forecasting model (WRF), which can ultimately be used to force TOMCAT. 2. Weather Research and Forecasting (WRF) Model • Next generation mesoscale NWP system. • Equations: Fully compressible, Euler non-hydrostatic. • Vertical coordinate: Terrain-following hydrostatic pressure. • Horizontal grid: Arakawa C-grid staggering. • Time Integration: Time-split integration using a 3rd order Runge-Kutta scheme with smaller time step for acoustic and gravity-wave modes. • Detailed microphysics (microphysics, PBL, radiation, cumulus parameterisations and surface physics etc). • http://www.wrf-model.org Table 1. WRF Model Configuration Fig. 1. An example Comparison of SLIMCAT with M55 data on 25 Nov 2005. Run D01 Fig. 2. IR cloud images from GMS-5 satellite on 16 Nov 2005. Also shown are M55 and Falcon aircraft locations. Fig. 3. Observed 24-hour accumulated total precipitation (mm) since 16 Nov 2005. Run D02 Fig. 7. 700 hPa wind at 0800 UTC 16 Nov 2005 from D02. Low level jet brings a large amount of water vapour to north Australia. Fig. 5. Simulated 24-hour accumulated total precipitation (mm) from WRF since 16 Nov 2005 from two WRF simulations. Fig. 4. Domains used in WRF model simulations and the corresponding terrain height (m). Fig. 8. As Fig. 7 but for diagnosed equivalent potential temperature (e) at 850 hPa. The distribution of high e is consistent with rainfall belt. Fig. 9. Evolution of cloud water (04UTC, 07UTC, 09UTC) during the first scientific flight on 16 Nov. 2005. • Results • The coarse resolution WRF run (D01) underestimates the observed accumulated total precipitation (Figure 5 and Figure 3). The higher resolution run (D02) improves on this. However, the simulated location of rainfall is still not satisfactory. Further sensitivity experiments need to be performed. • Low-level jet brings a large amount of water vapour to north Australia and the distribution of high e (warm and high humidity) is consistent with the distribution of rainfall belt (Figures 3, 7 and 8). There is intensive divergence on the upper levels near Darwin. • The modelled top of cloud water around Darwin was below 4Km (Figures 9) while the cloud top reached ~12 Km around Indonesia during the first flight . • Quality of ECMWF Temperature need to be checked (Figures 10). Fig. 6. 100hPa streamline and divergence at 0900 UTC 16 Nov 2005 from D01. • Conclusions • Mesoscale WRF model provides high spatial and temporal resolution simulations which will be useful to force our SLIMCAT/TOMCAT CTM. • Detailed comparison with observations measured during Darwin Campaign especially the transport of water vapor in the TTL will be studied. Fig. 10. Same As Fig. 1, but for the first scientific flight on 16 Nov. 2005. Acknowledgements. We are grateful for the use of SCOUT-O3 campaign data and to NCEP for the global analyses. This work was supported by the EU. References: Stamarock, W. C., et al., A description of the Advanced Research WRF version 2, 2005. For more information about this poster: Wuhu Feng, School of Earth and Environment, University of Leeds, Leeds, LS2 9JT Email: fengwh@env.leeds.ac.uk