Download
1 / 16
170 likes | 281 Views
NC Schools Dropout Data. 2007-08 Consolidated Data Report Annual Report of Dropout Rates Annual Report of Suspensions & Expulsions Annual Report of School Crime & Violence. Crime & Violence Rates 2002-03 to 2007-08 Grades 9-12. Grades 9-12 LEA Crime Rates (rates in acts per 1000 students).

E N D
NC Schools Dropout Data 2007-08 Consolidated Data Report Annual Report of Dropout Rates Annual Report of Suspensions & Expulsions Annual Report of School Crime & Violence Consolidated Data Report
Crime & Violence Rates 2002-03 to 2007-08Grades 9-12 Consolidated Data Report
Grades 9-12LEA Crime Rates (rates in acts per 1000 students) Consolidated Data Report
Crime & Violence Rates, 2007-08Lowest & Highest, Grades 9-12 Consolidated Data Report
3-Year Change in Crime & Violence Rates (2004-05 to 2007-08) Consolidated Data Report
Short-Term Suspension Rates 2003-04 to 2007-08Grades 9-12(Note:Charter Schools & LEAs Combined beginning in 2006-07) Consolidated Data Report
Grade 9-12 Short-Term Suspension Rates(suspensions per 10 students) Consolidated Data Report
Short-Term Suspension Rates, 2007-08Lowest & Highest, Grades 9-12 Consolidated Data Report
3-Year Change in Short-Term SuspensionRates (2004-05 to 2007-08) Consolidated Data Report
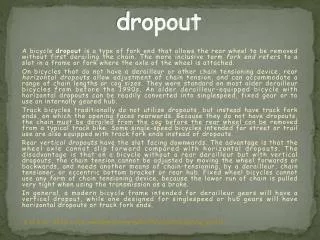
Dropout Rate Trends Consolidated Data Report
Grades 9-12 LEA Dropout Rates(dropouts per 100 students) Consolidated Data Report
Dropout Rates, 2007-08Lowest & Highest, Grades 9-12 Consolidated Data Report
3-Year Change in Dropout Rates(2004-05 to 2007-08) Consolidated Data Report
Consolidated Data Reports, 2007-08LEAs appearing on 2 or more reports Consolidated Data Report
3-Year Low/High RatesLEAs appearing on two or more reports(2004-05 to 2007-08) Consolidated Data Report
Consolidated Data ReportsLEA Performance vs. State Averages Consolidated Data Report