Download
1 / 16
160 likes | 277 Views
Making HIV-related maps in minutes: " Indiemapper " - free mapping tool for everyone. Yuliia Sereda , PhD Institute for Economics and Forecasting, NAS, Ukraine sereda@ief.org.ua. AIDS -2014 Workshop, 24/07/2014, Melbourne, Australia. Basic concepts, reasoning and software

E N D
Making HIV-related maps in minutes: "Indiemapper" - free mapping tool for everyone Yuliia Sereda, PhD Institute for Economics and Forecasting, NAS, Ukraine sereda@ief.org.ua AIDS-2014 Workshop, 24/07/2014, Melbourne, Australia
Basic concepts, reasoning and software • Indiemappertools • Practical exercise “HIV prevalence and affected populations in Europe” • Questions and answers Objectives
Agraphic representation of spatial concepts, where some real characteristics of geographical regions are replaced with symbols Photo credit: UNICEF Ukraine What is map?
Historical note • The first known world map was made in 2300century BC Babylonians (modern Iraq) on a clay tablet
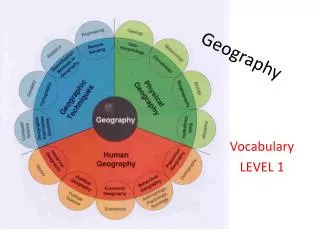
Type of software Tool-kit Approach to deal with spatial data Geographical Information Systems (GIS)
Attribute data – whata feature is Nominal data – names or of objects Categorical data – separates data into groups or classes Ordinal data – separates data based on quantitative rank Numerical data – data based on numbers with a standard interval between them Spatial data – wherethe feature is (co-ordinate based data) Data
Data on different themes are stored in separate “layers” Layers from different sources can be integrated using location Complex maps of HIV/AIDS related subjects from widely disparate sources Layers
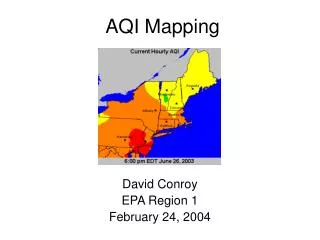
Comprehensible format to multiple audiences Estimated prevalence of HIV among young adults (15-49) in Africa (2005, UNAIDS)
Spatial relations • Certain diseases tend to occur in some places and not others John Snow(London, 1854)
Map for responses • Where are the transmission main spots? • Where are the prevention services? • Are the right services in the right places? • Do we have adequate coverage? Needs assessment, program planning and evaluation
Spatial distribution of disease • Mapping populations at risk • Trends, both temporal and spatial • Input, process, output and outcome evaluation • Planning and targeting interventions Maps for HIV/AIDS
Mapping software (1) • General: ArcGIS, GeoCommons, Target Map, CartoDB, Quantum GIS, MapBox, OpenHeatMap, Google Earth License, registration, extensive analytical capabilities The most commonly used GIS software usually cost $1500 per user license!
Mapping software (1) • HIV-related tools: • STATmapper - interactive maps from 54 surveys in 46 countries. Topics include HIV indicators. • HIVmapper- maps based on standard HIVindicators from surveys in over 20 countries • HIV Spatial Data Repository – HIV-related data for 49 countries • AIDSvu- AIDS information for the USA on a map Limited number of countries and indicators, non-targeted to specific project

![Making maps, many maps! [What is GIS?]](https://cdn0.slideserve.com/829117/making-maps-many-maps-what-is-gis-dt.jpg)