Download
1 / 16
160 likes | 324 Views
Permanent Monitoring Well Network Groundwater Nitrate 2009-2012. Montana Department of Agriculture Groundwater Protection Program. Montana Agricultural Chemical Ground Water Protection Act (MCA Title 80, Chapter 15, Sections 80-15-101 through 80-15-414). P olicy of Montana:

E N D
Permanent Monitoring Well Network Groundwater Nitrate 2009-2012 Montana Department of Agriculture Groundwater Protection Program
Montana Agricultural Chemical Ground Water Protection Act (MCA Title 80, Chapter 15, Sections 80-15-101 through 80-15-414) Policy of Montana: • protect ground water and the environment from impairment or degradation due to the use of agricultural chemicals • allow for the proper and correct use of agricultural chemicals • provide for the management of agricultural chemicals to prevent, minimize, and mitigate their presence in ground water • provide for education and training of agricultural chemical applicators and the general public on ground water protection, agricultural chemical use, and the use of alternative agricultural chemicals
Permanent Monitoring Well (PMW) Network • 41 wells sampled regularly 2009-2012 • Expected background nitrate 2 ppm • Most wells are located in agricultural land use • Irrigated and non-irrigated • Various crops
Groundwater sampling methods • Sample Schedule: • Samples collected twice a year when possible in spring and summer • SOP: • Well casing volumes purged three times • Field pH, specific conductance, dissolved oxygen, and temperature • Handling: • Samples stored in labeled amber glass bottles at 4°C for ≤10 days • Analysis: • MDA Analytical Laboratory Bureau ion chromatography or electrode • Nitrate measured as Nitrate-N
Data • 21 wells sampled every year 2009-2012 • Dataset assessed for outliers based on standardized residual values • PMWs with median GW nitrate >2ppm assessed for identifiable trends • Concentrations assessed in context of: • Accepted background nitrate level of 2 ppm (Mueller and Helsel, 1996) • Montana numerical standard for drinking water of 10 ppmNO3--N (MT DEQ, 2012)
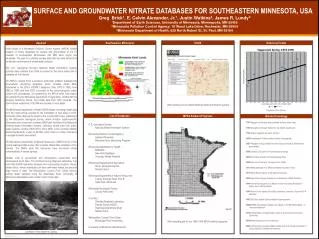
2009-2012 Findings • 243 total PMW GW samples 2009-2012 • Statewide median 2.9 ppm nitrate in PMW GW • Maximum 150 ppm nitrate in PMW GW • Most GW nitrate concentrations were in background level range of ≤2 ppm
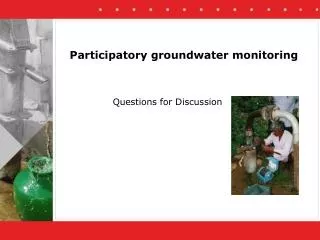
2009-2012 Findings: Overview and distribution -N -N -N -N
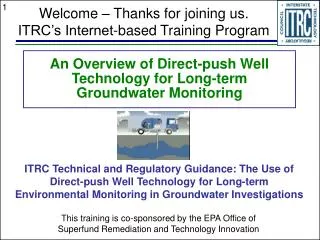
2009-2012 Findings: Identifiable trends Regression analysis with trend lines illustrating NO3--N concentration changes in PMWs MAD-1, SHE-1, T-1, and ROS-1 over time (2009-2012). An alpha level of 0.05 was used to determine a significant response in NO3--N with time.
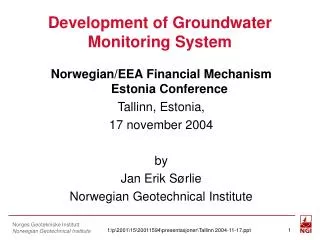
Upward trend 2009-2012 Findings: Identifiable trends and land use Dryland small grains and pulse Downward trend Dryland small grains with nitrogen management plan Upward trend Irrigated small grains and potatoes Upward trend Irrigated small grains and potatoes
Factors affecting PMW GW nitrate concentrations • Three primary factors over longer time intervals: • (1) Amount of source nitrogen available • (2) Water infiltration and percolation through surface and subsurface materials • (3) Potential for NO3- reduction and/or denitrification • Land use: summer fallow practices with associated mineralization of organic matter and excessive irrigation on well-drained soils
Conclusion • Most of the MDA PMW network has consistent accepted background levels of nitrate (≤2 ppm) • Statewide MDA PMW median nitrate (2.9 ppm) indicates influence of human activities • Elevated levels of PMW nitrate may be linked to land use practices in small grains
References • Bauder, J.W., Sinclair, K.N., and Lund, R.E. (1993). Physiographic and land use characteristics associated with nitrate-nitrogen in Montana groundwater. Journal of Environmental Quality, 22, 255-262. • Canter, Larry W. (1997). Nitrates in Groundwater. Boca Raton, FL: CRC Press, Inc. • Census & Economic Information Center. Census 2010: Montana Population Density by County. MT Department of Commerce, April, 2011. Web. 03 Jan. 2014 <http://ceic.mt.gov/Documents/Maps/Population/PopDensity10.pdf>. • Lindsey, B.D., and Rupert, M.G. (2012). Methods for evaluating temporal groundwater quality data and results of decadal-scale changes in chloride, dissolved solids, and nitrate concentrations in groundwater in the United States, 1988–2010 (U.S. Geological Survey Scientific Investigations Report 2012–5049). United States Geological Survey. • McLayCD, Dragten R, Sparling G, Selvarajah N. (2001). Predicting groundwater nitrate concentrations in a region of mixed agricultural land use: a comparison of three approaches. Environmental Pollution, 115, 191-204. • Montana Department of Environmental Quality (MT DEQ), Planning Prevention and Assistance Division, Water Quality Planning Bureau, Water Quality Standards Section. (2012.) DEQ‐7 Montana Numeric Water Quality Standards. Montana Dept. of Environmental Quality. • Mueller, D.K., and Helsel, D.R. (1996). Nutrients in the Nation’s waters Too much of a good thing? (U.S. Geological Survey Circular 113). United States Geological Survey. • Nimick, D.A., and Thamke, J.N. (1998). Extent, magnitude, and sources of nitrate in the Flaxville and underlying aquifers, Fort Peck Indian Reservation, northeastern Montana (U.S. Geological Survey Water-Resources Investigations Report 98-4079), United States Geological Survey. • Postma, D., Boesen, C., Kristiansen, H., and Larsen, F. (1991). Nitrate reduction in an unconfined aquifer: water chemistry, reduction processes, and geochemical modeling. Water Resources Research, 27, 2027-2045. • Puckett, L.J. and Cowdery, T.K> (2002). Transport and fate of nitrate in a glacial outwash aquifer in relation to ground-water age, land use practices and redox processes. Journal of Environmental Quality, 31 (3), 782-796. • Schmidt, C. (2009). Permanent monitoring well network nitrate-N summary report 2003-2008. Montana Department of Agriculture. • Schmidt, C. and Mulder, R. (2010). Groundwater and Surface Water Monitoring for Pesticides and Nitrate in the Judith River Basin, Central Montana. Montana Department of Agriculture. • Spalding, R. F. and Exner, M. E. (1993). Occurrence of Nitrate in Groundwater—A Review. Journal of Environmental Quality, 22, 392–402. • Spalding, R.F., and Parrott, J.D. (1994). Shallow ground water denitrification. The Science of the Total Environment, 141, 17-25.