Download
1 / 38
380 likes | 479 Views
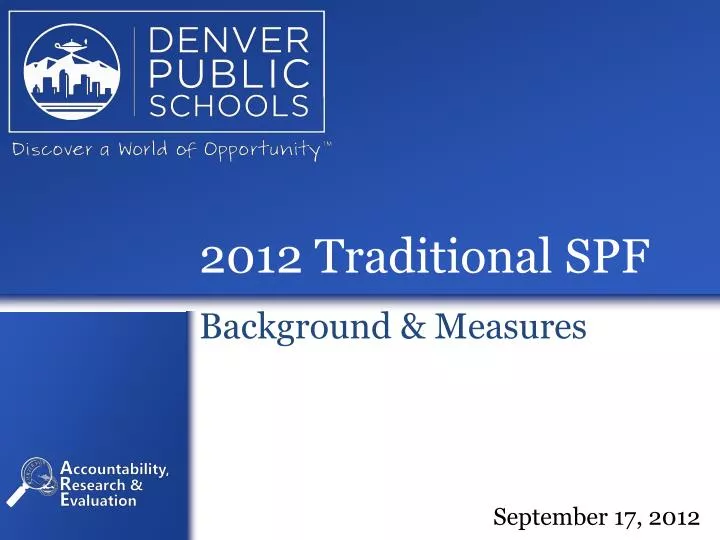
2012 Traditional SPF. Background & Measures. September 17, 2012. Purposes of the SPF. Provides a body of evidence related to student and school performance Is the basis of school accreditation ratings required by statute Aligns district goals, state requirements, and federal mandates

E N D
2012 Traditional SPF Background & Measures September 17, 2012
Purposes of the SPF • Provides a body of evidence related to student and school performance • Is the basis of school accreditation ratings required by statute • Aligns district goals, state requirements, and federal mandates • Provides information for teacher and principal compensation systems
New Methodology To Determine Similar Schools *Mobility is defined as the total number of students who entered or left the school after 10/1 divided by the number of students in the school as of 10/1.
Similar Schools Calculations Example FRL(40%) + ELL(20%) + SpEd(20%) + Mobility(20%) = School Characteristics Indicator School F’s Cluster
2012 SPF Indicators & Measures: Growth and Status *measure modified from 2011 SPF
Status & Growth Indicators:CSAP % Proficient or Above • Two separate measures: • Percentage of students “Proficient” or “Advanced” on Reading, Writing, Math, and Science • Percentage of students “Proficient” or “Advanced” (based on the tests above) compared to similar schools in the district • Lectura and Escritura are included in this measure.
Status & Growth Indicators: Gap STATUS Measures
Status & Growth Indicators:% CSAP Advanced • Measures the percentage of tests scored at “Advanced” on the CSAP in relation to all tests administered at a particular school
Status & Growth Indicators: % Above Proficient on CELA • The Colorado English Language Assessment (CELA) measures the speaking, listening, reading and writing skills of English language learners. • Measures the percentage of tests scored Above Proficient on the CELA in relation to all tests administered at a particular school
Status & Growth Indicators: DRA2/EDL2 Status
Status & Growth Indicators:Growth Percentiles • In order to receive a growth percentile, students need a valid English CSAP/ TCAP score over two consecutive years with a typical grade level progression (e.g., third grade to fourth grade) • Each student receives a growth percentile indicating how much growth they achieved in the current year compared to other students who earned similar scores in prior years. A growth percentile of 50 is considered “typical” growth. • Every student’s growth percentile is then rank-ordered and the middle score, or median, for the population is identified. This is the median growth percentile (MGP). • For accountability purposes (i.e., inclusion in the SPF, students need to have been enrolled in the same school since October 1 of the same school year.
Status & Growth Indicators:Growth Percentiles cont. 650 99th Percentile 600 78th Percentile 440 50th Percentile 413 CSAP (MATH) SCALE SCORE 400 399 25th Percentile 360 308 374 200 8th Percentile 2009 2010 2011 2012 TEST YEAR 598
Status & Growth Indicators:Catch-Up & Keep-Up Growth • Includes all students who took CSAP for two consecutive years. • Different from the state’s Catch-Up and Keep-Up. • State’s is progress needed to be proficient in 3 years or by 10th grade. • DPS Catch-up: the percentage of students transitioning from a lower to higher performance level from one year to the next. • DPS Keep-up: the percentage of students staying in the proficient and advanced categories or moved from proficient to advanced. • This measure is limited to CSAP Reading, Math, and Writing.
Status & Growth Indicators: Continuously Enrolled Growth • Addresses the transient student population • Accounts for growth shown by continuously enrolled students • 3 years in the same school • Uses median growth percentile as measure • Not applicable to high schools
Status & Growth Indicators: CoAlt/CSAP-A Growth • Similar to the concept of Catch-Up and Keep-Up • Students moving from CSAP-A to taking CSAP are considered improving. • 16 students are needed to be rated on this measure
Status & Growth Indicators: Gap GROWTH Measures
Status & Growth Indicators: CELA Growth
2012 SPF Indicators & Measures: PSR Growth and Status *measure modified from 2011 SPF **new measure for 2012 SPF
PSR Status & Growth Indicators:Colorado ACT • The percentage of students who are “proficient” on Reading, Math, English, and Science. • “Proficient” are benchmarks defined by ACT as “college ready”. • Reading = 21 • English = 18 • Math = 22 • Science = 24
PSR Status & Growth Indicators: 10th Grade CSAP to COACT
PSR Status & Growth Indicators:CDE ‘best of” grad rate • Each year, schools receive graduation rates from CDE for several different cohorts, or “class of”. The SPF uses the best rate of those available. • Note there is a one year lag for this measure (i.e., graduation rates for the most recent school year are not yet available when the SPF is published in the fall) Current Year
PSR Status & Growth Indicators: CDE “best of” graduation rate change Prior Year Current Year
PSR Status & Growth Indicators: DPS four year within school graduation rate change
PSR Status & Growth Indicators:On-Track to Graduation • Are students on-track to where they should be based on the number of years since they first entered 9th grade? For example, having 60 credits (or DPS equivalent) by end of 9th grade is considered to be “on track”. • This measure only includes grades 9-11 as 12th graders are addressed in the official graduation rates.
PSR Status & Growth Indicators: AP, IB, Post-Secondary Course Measures • Post-Secondary Course Credit/IB Enrollment: percent of students who take at least one of these courses. (For schools that do not offer AP courses, AP tests taken will be counted as AP course enrollment.) • AP and IB test taking rate: proportion of tests taken compared to courses taken. • AP and IB test passing rate: proportion of tests with a passing score (3 for AP, 4 for IB) compared to tests taken. • Post-Secondary Course Passing Rate: proportion of courses with a passing grade (C or above) compared to courses completed.
PSR Status & Growth Indicators: College Remediation – Status & Growth
2012 SPF Indicators & Measures: Student & Parent Engagement & Enrollment *measure modified from 2011 SPF **new measure for 2012 SPF
Student Engagement & Satisfaction:Attendance, Satisfaction, Center-Based Programs Attendance: Measures the school’s average attendance rate Student Satisfaction: The Student Satisfaction Survey is administered annually to all students. Measures the school’s percentage of student satisfaction survey items that received a positive response Schools must have a minimum of a 50% student response rate in order to earn points on this measure Center-based programs are worth up to 3 extra credit points (added to the total points earned but not in the total possible points).
Enrollment Indicator Re-enrollment, enrolled entire year, dropout rate
Enrollment Indicator Enrollment Net Change Bonus Points October Count March 1 End of Year
Parent Engagement Indicator:Parent Satisfaction & Response Rate • The Parent Satisfaction Survey is administered to all parents every April. • Parent Satisfaction • Measures the school’s percentage of parent satisfaction survey items that received a positive response. • Response Rates • Measures the response rate of parents who filled out and returned a parent satisfaction survey • Schools must achieve a 50% response rate to receive full points on this measure
Computation Process Exceeds Standard Meets Standard Approaching Standard Does Not Meet Standard Level 1 Data Collection & Aggregation Apply SPF Rubrics Measure Points & Stoplight Level 2 Sum and Apply Cut-Offs Indicator Total Stoplight Level 3 Sum and Apply Cut-Offs Overall Total Accreditation Rating Level 4
Computation Process: Based on 2-Years of Data Cut-points Two-year rubric
Computation Process: Based on 2-Years of Data Example: TCAP Median Growth Percentile 2012: Meets 2011: Approaching 2012 Measure Rating: Approaching
Have a question??? Contact: spf@dpsk12.org