Download
1 / 63
630 likes | 778 Views
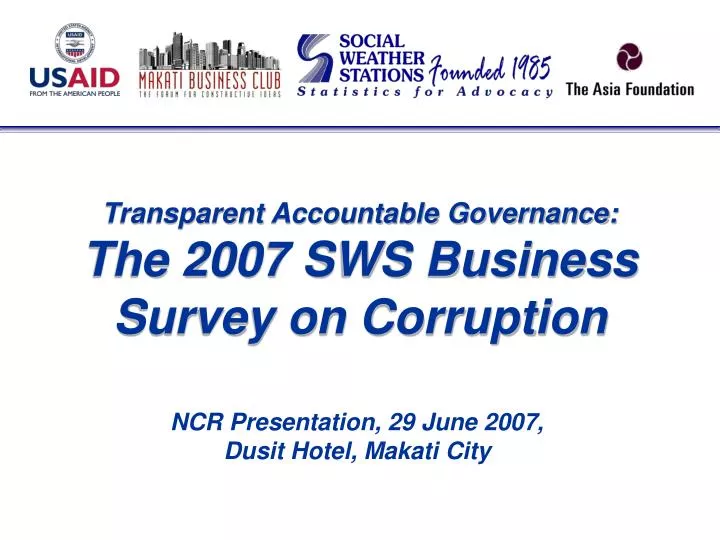
SWS Surveys of Enterprises on Corruption 2000-2007. Transparent Accountable Governance: The 2007 SWS Business Survey on Corruption. NCR Presentation, 29 June 2007, Dusit Hotel, Makati City. Disclaimer.

E N D
SWS Surveys of Enterprises on Corruption 2000-2007 Transparent Accountable Governance: The 2007 SWS Business Survey on Corruption NCR Presentation, 29 June 2007, Dusit Hotel, Makati City
Disclaimer The SWS Surveys of Enterprises on Corruption are sponsored by The Asia Foundation (TAF) with support from the United States Agency for International Development (USAID). Opinions expressed here are those of the SWS research team and do not necessarily reflect the views of TAF or USAID.
Background of Survey of Enterprises (cf. TAG) Over 2000-2007, SWS has done 7 Surveys of Enterprises on Corruption, within the Transparent and Accountable Governance (TAG) project, in close partnership with the Makati Business Club. These are surveys of Filipino managers -- unlike surveys of foreign consulting firms used to derive international corruption indexes, which use the views of expatriatemanagers of multinational firms.
Background of Survey of Enterprises (cf. TAG) From NCR in the first 3 rounds, the TAG surveys of enterprises added Metro Cebu and Metro Davao starting 2004, and Cavite-Laguna-Batangas and Cagayan de Oro-Iligan starting 2005. In every area, the TAG surveys worked with local business associations in obtaining the sampling frames, setting the agenda by focus groups, and disseminating the survey findings.
Outline Outline Survey Design Survey Results 1. The Scale of Corruption 2. Government Sincerity in Fighting Corruption 3. Solicitations of Bribes 4. Election Contributions 5. Use of Honest Business Practices 6. Participation in Fighting Corruption 7. A“Transparency Information Bureau” 8. The Business Weather Summary of Findings
Background of Survey of Enterprises (cf. TAG) The TAG Project Surveys a. Are Time Series 7 rounds (2000-07): National Capital Region 4 rounds (2004-07): Metro Cebu, Metro Davao 3 rounds (2005-07): Cavite-Laguna-Batangas, Cagayan de Oro-Iligan. b. Are Stratified by Size 2/3 weight: Small & Medium Enterprises 1/3 weight: Large Enterprises.
SWS SURVEYS OF TOP/MIDDLE MANAGEMENT OF ENTERPRISES ON CORRUPTION, 2000-2007 Fieldwork Total Small & Error DatesAreaSampleLargeMediumMargin Aug14-Oct26 2000 NCR 604 204 400 ± 4% Sep4-Dec4 2001 NCR 505 200 305 ± 4½% Oct25-Feb25 2002/03 NCR 500 214 286 ± 4½% Nov13-Jan28 2003/04 NCR/C/D 701 285 416± 4% Jan21-Mar15 2005 5 areas 701 232 469 ± 4% Feb18-Apr27 2006 5 areas 700 231 469 ± 4% Mar4-May11 2007 5 areas 705 233 470 ± 4% NCR 354 117 237 ± 5% CALABA=Cavite/Laguna/Batangas 76 24 52 ± 11% C=Metro Cebu 100 33 67 ± 10% D=Metro Davao 100 33 67 ± 10% CDO-I=Cagayan de Oro/Iligan City 75 24 51 ± 11% TABLE: Technical Information about the Surveys
Panel data The panel survey design, or overlap of samples, enhances the validity of time-comparisons Total Interviewed Newly inter- 2007 in both 2006 viewed in interviews& 20072007 FIVE AREAS705486219 NCR 354 211 143 CALABA 76 58 18 Cavite 25 17 8 Laguna 26 18 8 Batangas 25 23 2 Metro Cebu 100 80 20 Metro Davao 100 79 21 CDO-I 75 58 17 Cagayan de Oro 50 36 14 Iligan city 25 22 3
1. The Scale of Corruption 3 of 5 managers see A LOT of corruption in the public sector. 1 of 2 say MOST/ALMOST ALL the firms in their line of business give bribes to win govt contracts; 1 of 5 say this on giving bribes to win private sector contracts. However, in NCR at least, bribing for govt. contracts has declined. Discouragement on the possibility of running government without corruption has grown; split opinion now prevails.
100% THERE IS “A LOT” OF CORRUPTION IN THE PUBLIC SECTOR 2000 2001 2003 2004 2005 2006 2007 77 80% 71 67 67 67 66 65 63 61 60 60% 40% 20% 0% 5 AREAS NCR 3 of 5 managers see “a lot” of corruption in the public sector
100% 2000 2001 2003 2004 2005 2006 2007 80% 60% THERE IS “A LOT” OF CORRUPTION IN THE PRIVATE SECTOR 40% 20% 14 13 11 10 10 9 9 8 8 7 0% 1 of 12 managers see “a lot” of corruption in the private sector 5 AREAS NCR
“MOST/ALMOST ALL COMPANIES IN MY LINE OF BUSINESS GIVE BRIBES TO WIN PUBLIC SECTOR CONTRACTS.” 70% 60% 57 57 56 55 54 52 48 2000 50% 46 46 42 2001 2003 40% 2004 2005 30% 2006 2007 20% 10% 0% 5 AREAS NCR Bribing for govt. contracts: declining in NCR, not elsewhere; 20% is the median allowance
80% 70% 2000 60% 2001 “MOST/ALMOST ALL COMPANIES IN MY LINE OF BUSINESS GIVE BRIBES TO WIN PRIVATE SECTOR CONTRACTS.” 50% 2003 2004 40% 29 28 26 26 2005 24 23 22 22 18 18 30% 2006 2007 20% 10% 0% 5 AREAS NCR Bribing for private contracts: also declining slightly in NCR; 10% is the median allowance
PERSONALLY KNEW OF A CORRUPT TRANSACTION WITH GOVT. BY A COMPANY IN OWN SECTOR IN THE LAST 3 MONTHS 60% 51 48 50% 46 44 44 39 38 40% 2004 2005 30% 2006 2007 20% 10% 0% NCR 5 AREAS Many managers have recent personal knowledge of a corrupt transaction with government
100% Corruption is part of the way the govt. works 80% 40 40 42 44 43 44 44 44 50 52 60% 40% 60 60 57 The govt. can be run w/o corruption 56 55 56 56 55 49 48 20% 0% ‘05 ‘06 ‘07 ‘00 ‘01 ‘03 ‘04 ‘05 ‘06 ‘07 There is growing discouragement on whether government can be run without corruption. 5 AREAS NCR
2. Government Sincerity in Fighting Corruption Of 29 agencies rated, 12 are positive and 17 are negative. 8 are Moderate, Good or Very Good, 9 are Mediocre (approximately zero), and 12 are Poor, Bad or Very Bad. Compared to 2006, the ratings are either Better or Not As Bad; only PCGG is Worse. Note: Filipino Business Assns rate Very Good.
+66 +54 +52 +48 +45 +40 +40 +38 +32 +26 Filipino Business Associations DTI SSS Supreme Court DOH Good Sincerity: Filipino Business Associations, DTI, SSS, Supreme Court, DOH VERY GOOD GOOD +80 +70 +60 +50 +40 +30 +20 2005 +10 0 2006 -10 2007 -20 -30 NET SINCERITY IN FIGHTING CORRUPTION
NET SINCERITY IN FIGHTING CORRUPTION +60 +50 +27 +26 +22 +40 +19 +20 +14 +13 +13 2005 +30 +5 +5 +5 2006 +20 Sandiganbayan +10 City / Municipal Gov't GSIS COA 2007 0 -10 -20 Moderate Sincerity: City Gov’t, COA, Sandiganbayan, GSIS
+40 NET SINCERITY IN FIGHTING CORRUPTION Office of the Pres. +24 +30 +22 2005 +20 +11 +10 +10 +10 +9 +5 +5 +5 Senate PAGC DA AFP +3 +3 +10 2006 0 0 DepEd Trial Courts DBM Ombudsman 2007 -3 -7 -7 -10 -8 -8 -9 -13 -15 -17 -17 -20 -19 -24 -38 Mediocre Sincerity: DepEd, Trial Courts, Ombudsman, DBM, Office of the President, Senate, PAGC, DA and AFP +40 +30 +20 2005 +10 0 2006 -10 2007 -20 -30 -40
NET SINCERITY IN FIGHTING CORRUPTION +30 DOJ +20 +13 PCGG +10 +5 2005 DOTC DILG DENR 0 2006 -10 2007 -13 -13 -20 -17 -18 -19 -19 -22 -20 -23 -30 -32 -40 -39 -50 -44 -60 Poor Sincerity: DOTC, DILG, DOJ, PCGG, DENR
+20 House of Reps. 2005 +10 LTO COMELEC BIR PNP 0 2006 -10 2007 -20 -30 -23 -28 -31 -32 -40 -36 -38 -36 -40 -42 -50 -45 -49 -60 NET SINCERITY IN FIGHTING CORRUPTION -58 -59 -59 -70 Bad Sincerity: PNP, LTO, House of Reps, COMELEC, BIR
NET SINCERITY IN FIGHTING CORRUPTION +30 +20 Bureau of Customs 2005 +10 DPWH 0 2006 -10 2007 -20 -30 -40 -50 -60 -55 -70 -66 -66 -68 -74 -80 -75 Very Bad Sincerity: DPWH, BOC
Ratings of almost all agencies for sincerity in fighting corruption are up in 2007. Of 28* agencies rated in both 2006 & 2007: 11 got better (a higher +), 16 are not as bad (a lower -), 1 got worse (a higher -). *DTI and Filipino Business Associations were covered for the first time in 2007.
BOTH MANAGERS AND THE GENERAL PUBLIC ARE OPTIMISTIC ABOUT GPRA: “… a law that provides for the standard rules in public bidding for government projects to guarantee that all contractors are given equal opportunity to join and win a government contract… is called the Government Procurement Reform Act [GPRA] or RA 9184. Have you heard or read something about GPRA? If yes: do you think this law will help reduce corruption in government contracts?” GENERAL 2007 SURVEY OF ENTERPRISES PUBLIC: TotalNCRCALABACebuDavaoCDO-IRP Nov06 Aware 54% 61% 36% 50% 51% 51 13% Will definitely help 32 29 52 28 33 39 25 Will probably help 51 53 37 56 51 50 51 Will probably not help 10 11 11 12 6 8 14 Will definitely not help 6 6 0 4 10 3 6 Not aware 46 39 64 50 49 49 86
3. Solicitations of Bribes For 3 surveys now, 3 of 5 managers were asked for a bribe the year before on at least one of 7 index transactions. For every index transaction, more said they were asked for a bribe in the 2007 survey than in both the 2006 and 2005 surveys. In NCR, which has the longest survey-series, many of the trends are poor. Only 6% reported to authorities that they had been asked for a bribe.
GRAPH: Solicitation of bribes, by transaction with government 61 40 37 33 25 22 20 13 2007: Enterprises asked last year by anyone in govt. for a bribe on the following transactions: Any one of the listed bribes Getting Local govt. permits and licenses Getting Natl. govt. permits and licenses Paying income taxes Complying with import regulations Supplying govt. with goods/services Collecting receivables from govt Availing of govt. incentives
100% 2000 2001 2003 2004 2005 2006 2007 80% ENTERPRISES ASKED FOR A BRIBE LAST YEAR 60% 55 54 50 48 46 45 42 40 36 40% 33 20% 0% Bribes asked for Local gov’t permits/licenses: 5 AREAS NCR
100% 2000 2001 2003 2004 2005 2006 2007 80% ENTERPRISES ASKED FOR A BRIBE LAST YEAR 60% 43 42 37 37 36 40% 34 33 32 29 28 20% 0% 5 AREAS NCR Bribes asked for National gov’t permits/licenses:
100% 2000 2001 2003 2004 2005 2006 2007 80% ENTERPRISES ASKED FOR A BRIBE LAST YEAR 60% 52 50 43 42 36 40% 34 33 33 30 29 20% 0% Bribes asked for Paying income taxes: 5 AREAS NCR
100% 2000 2001 2003 2004 2005 2006 2007 80% ENTERPRISES ASKED FOR A BRIBE LAST YEAR 60% 40% 31 28 25 25 22 21 18 17 20% 15 10 0% 5 AREAS NCR Bribes asked for Complying with import regulations:
100% 2000 2001 2003 2004 2005 2006 2007 80% 60% ENTERPRISES ASKED FOR A BRIBE LAST YEAR 40% 22 22 18 18 18 20% 16 15 15 14 13 0% Bribes asked for Supplying gov’t with goods/services: 5 AREAS NCR
100% 2000 2001 2003 2004 2005 2006 2007 80% 60% ENTERPRISES ASKED FOR A BRIBE LAST YEAR 40% 20 19 18 18 16 20% 15 13 10 9 8 0% Bribes asked for Collecting receivables from govt: 5 AREAS NCR
100% 2000 2001 2003 2004 2005 2006 2007 80% 60% ENTERPRISES ASKED FOR A BRIBE LAST YEAR 40% 20% 13 13 11 11 10 10 9 6 4 4 0% Bribes asked for Availing of govt incentives: 5 AREAS NCR
1 100% 1 35 34 39 33 39 80% 42 60% Don’t Know/ Refused 40% Not asked for listed-bribe 60 62 55 62 56 Was asked; did not report it 53 Was asked; reported it 20% 7 6 5 4 4 3 0% ‘05 ‘06 ‘07 ‘05 ‘06 ‘07 Reporting of bribe-solicitation 5 AREAS NCR
4. Election Contributions Almost 1 of 4 (23%) said that a typical company in their sector would make a donation to the 2007 (current) election campaign. (It was 45% in 2003/04, 48% in 2002/03) Ave. estimated donation: P245,000 Large companies P387,000 SMEs P173,000
DONATIONS MADE BY A TYPICAL COMPANY FOR POLITICAL CAMPAIGNS, BY SIZE OF DONATION, 2 SURVEYS Donations made by a typical company for political campaigns 2002/032003/042007 (NCR) (NCR/C/D) (5 areas) Nothing 42% 54% 76% Less than P50,000 18 13 9 P50,000-99,000 worth 12 8 3 P100,000-499,000 worth 11 13 6 P500,000-999,000 worth 5 5 1 P1,000,000+ worth 8 5 2 Don’t know/Refused 4 2 1 Average donation P159,000 P309,000 P245,000
5. Use of Honest Business Practices Only 50% say that companies in their line of business always demand receipts. Only 35% say they always issue receipts. Only 24% say they only keep one set of books. Only 18% say they pay taxes honestly. Use of these practices is slightly growing in NCR, but is hardly changing in the country as a whole.
GRAPH: Honesty in business practices None 100% 1 2 2 2 6 6 12 Hardly any 18 80% 28 35 Few 36 60% 44 39 Most 40% 38 50 20% 35 Almost all 24 18 0% Keep only one set of books Demand receipts Issue receipts Pay taxes honestly “How many companies in your line of business practice the following?”
TABLE: In your line of business, how many companies always demand and issue receipts, keep one set of accounts, and pay taxes honestly? MANAGERS SAYING “ALMOST ALL” COS. IN THEIR LINE OF BUSINESS ALWAYS DEMAND RECEIPTS 60% 55 53 55% 51 50 49 48 50% 45% 40% 35% 2005 30% 2006 2007 25% 20% 15% 10% 5% 0% Demanding receipts, upward in NCR: 5 AREAS NCR
TABLE: In your line of business, how many companies always demand and issue receipts, keep one set of accounts, and pay taxes honestly? 60% MANAGERS SAYING “ALMOST ALL” COS. IN THEIR LINE OF BUSINESS ALWAYS ISSUE RECEIPTS 55% 50% 45% 42 38 40% 37 2003 36 35 35 33 35% 2004 32 30% 2005 2006 25% 2007 20% 15% 10% 5% 0% Issuing receipts: not much change 5 AREAS NCR
TABLE: In your line of business, how many companies always demand and issue receipts, keep one set of accounts, and pay taxes honestly? 60% 55% MANAGERS SAYING “ALMOST ALL” COS. IN THEIR LINE OF BUSINESS KEEP ONLY ONE SET OF BOOKS 50% 45% 40% 2003 35% 2004 30% 2005 25 25 24 23 23 2006 25% 22 21 2007 18 20% 15% 10% 5% 0% Keeping only 1 set of books: slightly up in NCR 5 AREAS NCR
TABLE: In your line of business, how many companies always demand and issue receipts, keep one set of accounts, and pay taxes honestly? 60% 55% 50% 45% 40% MANAGERS SAYING “ALMOST ALL” COS. IN THEIR LINE OF BUSINESS PAY TAXES HONESTLY 2003 35% 2004 30% 2005 2006 25% 20 19 2007 18 18 20% 17 17 15 15% 11 10% 5% 0% Paying taxes honestly: slightly up in NCR 5 AREAS NCR
6. Participation in Fighting Corruption Managers’ willingness to support an anti-corruption fund is 2% of Net Income (median) -- down from 5% in 2006. In the last 2 years, 2 of 5 spent to fight fraud & corruption in their companies -- ave. P292,000. In the next 2 years, 1 of 2 will spend -- ave. P233,000. In the last 2 years, 1 of 5 donated to a private anti-corruption fund -- ave. P136,000. In the next 2 years, 1 of 2 will donate -- ave. P100,000.
100% 3 5 6 7 7 2 8 9 11 13 3 2 2 4 3 5 5 1 80% 30 30 32 31 35 30 27 37 32 60% Don’t Know/ etc. 40% 65 62 60 60 Net Income will fall 57 56 54 54 52 No change 20% Net Income will rise 0% '06 '05 '07 ‘01 ‘03 ‘04 ‘05 ‘06 ‘07 Managers expect more Net Income if govt. corruption is reduced to that of Singapore 5 AREAS NCR
GRAPH: % of net income managers will pay for a program halving corruption in 10 yrs (graph) MEDIAN PORTION OF NET INCOME THE ENTERPRISE CAN PAY TO FUND A PROGRAM TO HALVE PUBLIC SECTOR CORRUPTION IN 10 YEARS 6% 5 5 5% 2000 4% 2001 2003 3 3 3% 2004 2.5 2005 2 2 2 2006 2% 2007 1 1 1% 0% 5 AREAS NCR But business willingness to give to an Anti-Corruption Fund met a setback:
85% 80% Last 2 years, Average P292,000 Next 2 years, Average P233,000 75% 70% 65% 61 60% 55% 50% 48 45% 40% 35% 30% 25% 20% 16 15% 12 10 9 10% 8 6 6 6 4 4 5% 3 3 0% Nothing < P10,000 P10,000- 99,000 P100,000- 199,000 P200,000- 499,000 P500,000- 999,000 > P1 Million Spending to combat fraud and corruption in own company: last 2 years and plans for next 2 years
85% 80 Last 2 years, Average P136,000 Next 2 years, Average P100,000 80% 75% 70% 65% 60% 55% 50 50% 45% 40% 35% 30% 25 25% 20% 15% 12 10% 6 5 4 5% 2 2 2 1 1 1 0 0% Nothing < P10,000 P10,000- 99,000 P100,000- 199,000 P200,000- 499,000 P500,000- 999,000 > P1 Million Contribution to a private anti-corruption program: last 2 years and plans for next 2 years
Test Statement: “A person like me cannot do anything to reduce corruption in the government” “A person like me cannot do anything to reduce corruption in the government” 29% 67% -38 “Compared to about 5 years ago, it is now easier for anyone who wants to bid on a government contract to get information about the bidding.” 54% 23% +31 “Assuming it takes away only one day from his/her usual activities,a citizen should always accept an invitation to observe a bidding for a government contract.”74% 15% +58 * Net agreement = % Agree minus % Disagree correctly rounded. Don’t Know and Refused responses are not shown. Most managers are predisposed to cooperate in fighting corruption AgreeDisagreeNet*
7. A Transparency Information Bureau (TIB): Managers are enthusiastic about a proposal to establish a TRANSPARENCY INFORMATION BUREAU (TIB) -- “… like a Credit Information Bureau, except that, instead of Credit Ratings, it will make Transparency Ratings on the reputation of individuals, companies, and agencies regarding honesty and ethics in business.”
TotalNCRCALABACebuDavaoCDO-I Very useful 41% 37% 39% 46% 37% 55% Somewhat useful 35 38 34 29 37 28 A little useful 16 14 22 14 20 13 Not at all useful 8 9 4 11 5 4 No answer/Don’t know/Ref 1 2 0 0 1 0 “How useful would the services of a Transparency Information Bureau be for your company?” -- 76% REPLY POSITIVELY