Download
1 / 38
390 likes | 659 Views
Fuel-efficient Cruise Control. ECE 345 Final Presentation. Anand Babu, Esther Yow, Jim Gill TA: Dave Crowe. Objective.

E N D
Fuel-efficient Cruise Control ECE 345 Final Presentation Anand Babu, Esther Yow, Jim Gill TA: Dave Crowe
Objective • To replace conventional automotive cruise control with a more fuel-efficient algorithm. This algorithm will accelerate on down hills and decelerate on up hills thus balancing load on the engine and increasing fuel economy. • To simulate this new algorithm and system in a laboratory setting. • To explore safety concerns of new algorithm and implement solutions. • To develop a user-friendly interface to control this algorithm. • To test this system in an actual operating environment (1993 Nissan Altima).
Original Design Overview • Windows-based PC • 1 Serial Port for Signal Acquisition • 1 Serial Portfor Throttle Control • 1 Parallel Portfor User Interface • 1 USB Portfor User Interface
Current Design Overview LCD Display User Keypad Motorola 68HC12 Microcontroller Vacuum Pump Engine Computer Wiring Harness Fuel Injector Signal Throttle Position Signal Vehicle Speed Signal
Current Design Details • Accept minimum and maximum speed from user • Use previously inputted terrain map to determine target speeds and accelerations for the route. • Enter into control loop to vary throttle position appropriately.
Implementation Plan • Work on individual modules separately (PID control, throttle control, signal acquisition, and user interface) • Integrate components in laboratory setting • Perform single feature tests in real life setting • Test system on previously inputted path
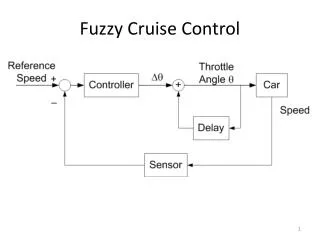
Control Algorithm • Throttle output is determined through the use of a proportional – integral – derivative algorithm • On flat ground algorithm uses vehicle’s speed to determine throttle / accelerator signal. Goal: Maintain constant speed • On hills, the algorithm uses vehicle’s acceleration to determine throttle / accelerator signal. Goal: Maintain constant acceleration
Control Algorithm Details Proportional Output = (desired speed - actual speed) * constant Integral Output = (value of error time integral) * constant Derivative Output = (value of error time derivative) * constant
Control Algorithm Simulation High Gain Constant Low Gain Constant
Throttle Control Picture connects to microcontroller Vacuum Pump #18955-1E800 Cruise Control Actuator #18910-1E800 connects to throttle
Throttle Control Design • Consulted Dealer Factory Service Manual for information; was unhelpful • Reverse engineered control information by trial and error in the laboratory • Tested throttle in actual car to determine appropriate range of throttle motion • Timed throttle opening at various positions to establish relationship between time open signal high to throttle position. • Due to linear relationship, throttle position could be inferred from throttle opening time.
Throttle Control Testing Laboratory Testing Ran testing loop to open throttle to set position, hold, and release Vehicle Testing Installed throttle actuator and vacuum pump in vehicle Tested constant throttle control using microcontroller by directing throttle to move to a series of locations and holding position at set locations
Throttle Control Challenges Microcontroller was reset whenever throttle changed state (I.e. from opening to closing) Throttle opening rate differed from throttle closing rate
Vehicle speed sensor Signal Acquisition Throttle Position Sensor HC12 Fuel Economy Serial port
Throttle Position Throttle position – connected a voltmeter to throttle position sensor and recorded voltages at various throttle positions. • From the voltage output, determine the throttle position • The data will be outputted through the serial port of the HC12
Fuel Injector From the shop manual, we learned that the fuel injector had a control signal that was pulse width modulated. Thus, the fuel economy could be measured simply by knowing the average duty cycle and fuel pressure. To test this theory, we attached an LED to the signal wire for the fuel injector and observed the LED’s behavior as fuel consumption changed (either with increased throttle application and/or increased RPM). When the vehicle was at idle, the led was very dim. Under hard acceleration, the LED became brightly lit.
Fuel Pump Fuel Injectors Fuel Injector Duty Cycle • Find average duty cycle (in percentage) over test range • Use average duty cycle and test time to calculate the amount of time injector is open. • Fuel consumption/unit distance = 4 * (average duty cycle) * (time) * (fuel pressure) (distance vehicle has traveled )
Fuel Injector Duty Cycle Implementation start Rising edge of the square wave triggers the pulse accumulator to increment, the falling edge will then stop accumulator. Current duty cycle = (time signal is high)/ ( period of signal) * 100 AccDutyCycle = current DC+ acc DC Increment count Interrupt per 131ms Average DC = Acc DC / count
Vehicle Speed (original) • Originally, we read the shop manual to understand basic sensor operation. We learned that the VSS was an oscillating signal produced at the transmission. • Continuously read the speed while t<0.1 • Compare the speed with the threshold • If the speed has changed from greater than the threshold speed to less than the threshold speed or vice-versa then increment the variable “change” • We can then find out the speed of the car by calculating number of rotations in 0.1s
Vehicle Speed (actual) • After additional testing • VSS – attached an LED to the signal wire for the speed sensor and observed the LEDs behavior as speed changed (ie – frequency of blinking) • Reason for difference • Vehicle’s engine computer internally converts oscillating signal to pulsing signal • Used the timer interrupt function on the HC12 to determine the time between pulse pulses. • Speed = circumference of the wheel/ time
Original User Interface • HD44780 LCD Display • Interfaced with laptop via Parallel Port • Implemented using Java • Required the use of Java COM API • Difficulty sharing ports with multiple • users when using Java • Very difficult to conduct real time • operations using the parallel port • External Keypad • Interfaced with laptop via USB port • Very simple to implement and operate
New User Interface • HD44780 LCD Display • Interfaced directly to port A and B of the HC912B32 microcontroller • 4x4 Matrix Keypad and MM74C922 16-key Encoder • Interfaced directly to Port B of the HC912B32 microcontroller and implemented on external interrupts.
Flowchart Display Intro Message WAI Keypad Enter Minimum Speed WAI Enter Max Speed WAI Display Speed, accel, Distance, minspeed, Maxspeed, and targetaccel
New Keypad Wiring Diagram MM74C922 Encoder 1 2 3 4 5 6 7 8 GD 10 11 12 13 14 15 16 17 y1 y2 y3 y4 x1 x2 x3 x4 4x4 Matrix Keypad 18 19 20 21 37 HC912
User Interface Testing • LCD Display Tests • Map out Data Display addresses on LCD • Determine LCD delay times based on Timing diagrams
User Interface Testing cont’d • Implement test code to verify functionality of external interrupt, keypad and encoder. • Assembly code would send the encoded keypunch through the serial interface.
User Interface Challenges • Initial Difficulties implementing user interface with Java and parallel port interface with laptop. • Sharing and real time functionality. • Difficulty attaining correct functionality of Keypad and encoder. • Difficulties finding the matrix values of a keypad punch. • Difficulties displaying ASCII characters on LCD • Insufficient delays between data transfer to the LCD
Overall challenges Inability to transfer MATLAB simulation code to microcontroller Inability to simulate feedback loop in laboratory testing of system. Inability to perform extensive testing in actual setting due to overhead required to change settings.
Recommendations for Future Measure position more accurately by using GPS to accurately retrieve stored terrain information. Additional fine tuning of constants in PID algorithm. Live test of complete system to analyze fuel efficiency improvements. Cost-benefit analysis to determine if efficiency gains make up for added complexity and cost of system.
Similar Devices in Marketplace We believe your proposed project is very interesting since we have made claim to the technology you describe via a series of patents in the U.S., Mexico and Canada. We are now commercializing the technology and have publicly demonstrated its effectiveness in 1999 (EconoCruise(r)). You may find it interesting to note that for over two years we have not heard of anyone (including automakers) coming up with this concept outside of ourselves. That is, until you. Consequently, I congratulate you on your engineering creativity, and wish you well with your academic project. Wayne Allison, President, Mirenco, Inc.
Mirenco Econocruise EconoCruise is an advanced application of Mirenco's patented SmartFoot technology, offering a self-educating software system to constantly monitor and manage a vehicle's performance. All variables affecting a vehicle's performance (e.g., RPM, exhaust emissions, speed, fuel usage, etc.) may be computer-analyzed in real time with knowledge of the road ahead via satellite Global Positioning System (GPS) signals. This "intelligent" cruise control is provided the desired engine performance criteria by the operator (e.g., best fuel-speed-emissions tradeoff), learns the topography of the roadway, and produces a precise, dynamic fuel delivery rate to achieve the desired results.