Download
1 / 52
540 likes | 727 Views
Goal evaluation of segmentation algorithms for traffic sign recognition. Hilario Gómez-Moreno, Saturnino Maldonado- Bascón , Pedro Gil-Jiménez, and Sergio Lafuente -Arroyo. ITS 2010. Outline. Introduction System Overview Segmentation Algorithms Color Space Thresholding

E N D
Goal evaluation of segmentation algorithms for traffic sign recognition Hilario Gómez-Moreno, Saturnino Maldonado-Bascón, Pedro Gil-Jiménez, and Sergio Lafuente-Arroyo. ITS2010
Outline • Introduction • System Overview • Segmentation Algorithms • Color Space Thresholding • Chromatic/Achromatic Decomposition • Edge-Detection Techniques • SVM Color Segmentation • Speed Enhancement Using a LUT • Experiment • Conclusion
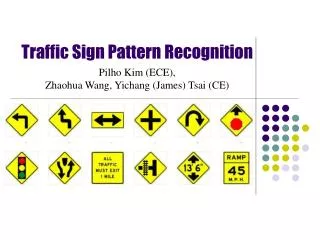
Introduction(1/5) • automatic traffic sign-recognition system have to deal various questions such as • Outdoor lighting conditions. • Camera and camera settings. • Deterioration of a traffic sign due to aging or vandalism affects its appearance. • Traffic sign images taken from a moving vehicle. • These problems particularly affect the segmentation step.
Introduction(2/5) • Segmentationis crucial to achieving good recognition results. • Several segmentation possibilities are thus available for thepresent study. • The goal of segmentation was to extract the traffic sign from the background.
Introduction(3/5) • Segmentation can be carriedout using color information or structural information. • In [17], many color-segmentation methods aredescribed and classified into different groups: • Feature-space-based techniques • Image-domain-based techniques • Physics-based techniques [17] L. Lucchese and S. K. Mitra, “Color image segmentation: A state-of-theartsurvey,” Proc. Indian Nat. Sci. Acad., vol. 67-A, no. 2, pp. 207–221,2001.
Introduction(4/5) • Feature-space-based techniques • Based on the color of each pixel. • Image-domain-based techniques • Using color and space information. • Physics-based techniques • Using physicalmodels. • In [18], 150 references were presented on color segmentation.Increase to about 1000 references, when if the grayscale methods included. [18] H. D. Cheng, X. H. Jiang, Y. Sun, and J. Wang, “Color image segmentation: Advances and prospects,” Pattern Recognit., vol. 34, no. 12, pp. 2259–2281, Dec. 2001.
Introduction(5/5) • Different color spaces are used: • normalization of the Red Green Blue (RGB) [11],[13] • RGB [19] • YUV [20] • Hue Saturation Intensity (HSI) [14], [16], [21]–[24] • Different edge detection method: • A Laplacian filter with previous smoothing was used in [25]. • Grayscale images were also used with a Canny edge detector in [26]. • Color image gradient was used in [7].
A Good Segmentation Need… • In this case, the best segmentation method gives the best recognition results. • The criteria for good recognition results include: • high recognition rate • low number of lost signs • high speed • low number of false alarms
Image for Testing • A set of images was needed to test the performance. • More than 100 000 images were obtained from different captured sequences. • A database was constructed from the images, but not all the images have been used. • Relevant frames were choice identified as posing possible problems in the segmentation step. • Focused on the Spanish traffic sign.
Outline • Introduction • System Overview • Segmentation Algorithms • Color Space Thresholding • Chromatic/Achromatic Decomposition • Edge-Detection Techniques • SVM Color Segmentation • Speed Enhancement Using a LUT • Experiment • Conclusion
System Overview • The traffic sign-recognition system, which was described in detail in [14], was used to evaluate segmentation algorithms. • The system consists of four stages.
System Overview – ShapeDetection • This stage is described in [27]. • The shapes considered are triangle, circle, rectangle, and semicircle. • Absolute values of the discrete Fourier transform (DFT) were used. [27] P. Gil-Jiménez, S. Maldonado-Bascón, H. Gómez-Moreno, S. Lafuente-Arroyo, and F. López-Ferreras, “Traffic sign shape classification and localization based on the normalized FFT of the signature of blobs and 2D homographies,” Signal Process., vol. 88, no. 12, pp. 2943–2955, Dec. 2008.
System Overview – Recognition • This stage was described in detail in [14]. • Recognition stage deal with the classified blobs. The Recognition task is divided into different colors and shapesto improve speed. • The input of this stage is a 31 × 31 pixels image in grayscale for every candidate object. • Different one-versus-all SVM classifiers with a Gaussian kernel were used. The traffic sign class with the highest SVM decision function output was assigned to each blob. [14] S. Maldonado-Bascón, S. Lafuente-Arroyo, P. Gil-Jiménez, H. Gómez-Moreno, and F. López-Ferreras, “Road-sign detection and recognition based on support vector machines,” IEEE Trans. Intell. Transp. Syst., vol. 8, no. 2, pp. 264–278, Jun. 2007.
System Overview – Tracking • The tracking stage [15] identifies correspondences between recognized traffic signs to give a single output for each traffic sign in the sequence. • At least two detections are required to consider the object as a traffic sign. [15] S. Lafuente-Arroyo, S. Maldonado-Bascón, P. Gil-Jiménez, H. Gómez-Moreno, and F. López-Ferreras, “Road sign tracking with a predictive filter solution,” in Proc. 32nd IEEE IECON, Nov. 2006, pp. 3314–3319.
Outline • Introduction • System Overview • Segmentation Algorithms • Color Space Thresholding • Chromatic/Achromatic Decomposition • Edge-Detection Techniques • SVM Color Segmentation • Speed Enhancement Using a LUT • Experiment • Conclusion
Segmentation Algorithms (1/2) • The implementation of these algorithms generates binary masks, thus enabling objects to be extracted from the background. • One mask was obtained for each color. (red, blue, yellow, white)
Segmentation Algorithms (2/2) • White is not a chromatic color but an achromatic color. • Chromatic/achromatic decomposition is carried out. • This idea, based on saturation and intensity values, was used in [28]. • This paper adapt each color space to identify achromatic pixels. [28] K. N. Plataniotis and A. N. Venetsanopoulos, Color Image Processing and Applications. New York: Springer-Verlag, 2000.
Color Space Thresholding (CST) • Using threshold to decide each pixels color. • The existing variations of this technique [18]are related to different spaces or different means to identify the thresholds. • The election of the color space is a key point in this technique [29]. • The empirical election of the thresholds cannot guarantee the best results; thus, an exhaustive search are used to validate them. [29] P. Kumar, K. Sengupta, and A. Lee, “A comparative study of different color spaces for foreground and shadow detection for traffic monitoring system,” in Proc. IEEE 5th Int. Conf. Intell. Transp. Syst., 2002, pp. 100–105.
Color Space Thresholding - RGBNT • RGB Normalized Thresholding(RGBNT) • The RGB space is one of the basic color spaces. • the high correlation between the three color and the effect of illumination makes it difficult to find the correct thresholds. • One solution couldbe the use of a normalized version of RGB to make r+g+b=1. • With low RGB values, the transformation is unstable
Color Space Thresholding - HST • Hue and Saturation Thresholding (HST)
Color Space Thresholding - HST • This method is simple and almost immune to illumination changes since hue is used. • The main drawbacks include the instability of hue and the increase in processing time due to the RGB-to-HSI transformation.
Color Space Thresholding - HSET • Hue and Saturation Color Enhancement Thresholding (HSET) • In [21], a different method for thresholdingHIS space. • To prevent the problems of a rigid threshold, a soft threshold based on the LUTs was used. [21] A. de la Escalera, J. M. Armingol, J. M. Pastor, and F. J. Rodríguez, “Visual sign information extraction and identification by deformable models for intelligent vehicles,” IEEE Trans. Intell. Transp. Syst., vol. 5, no. 2, pp. 57–68, Jun. 2004.
Color Space Thresholding - OST • Ohta Space Thresholding (OST) • [32] displays some desired characteristics about OST. Which is simplicity and can be used without high computational cost. • Effective for the segmentation of color images. • I1 component is related to illumination. • I2 and I3 are related to.
Chromatic/Achromatic Decomposition • Chromatic/achromatic decomposition tries to find the image pixels with no color information. • The methods presented extract gray pixels, and then, the brighter pixels are treated as white ones. • All of the methods are different since each one is applied to different color spaces.
Chromatic/Achromatic Index • Presented in [34]. • This method was used in [14] for such detection, together with hue/saturation thresholding. [14] S. Maldonado-Bascón, S. Lafuente-Arroyo, P. Gil-Jiménez, H. Gómez-Moreno, and F. López-Ferreras, “Road-sign detection and recognition based on support vector machines,” IEEE Trans. Intell. Transp. Syst., vol. 8, no. 2, pp. 264–278, Jun. 2007. [34] H. Liu, D. Liu, and J. Xin, “Real-time recognition of road traffic sign in motion image based on genetic algorithm,” in Proc. 1st Int. Conf. Mach. Learning Cybern., Nov. 2002, pp. 83–86.
RGB Differences • Although the previous index is useful, the use of a threshold to measure the difference between every pair of components is more realistic.
Normalized RGB Differences • The achromatic pixels can be found in a similar way to that shown in the previous section. • However, working in a normalized space requires only two differences, instead of three.
Saturation and Intensity (1/2) • When HSI or similar spaces are employed, the achromatic detection presented in [28] can be used. • Pixels with low saturation as achromatic since, with R, G, and B being equal (gray colors). [28] K. N. Plataniotis and A. N. Venetsanopoulos, Color Image Processing and Applications. New York: Springer-Verlag, 2000.
Saturation and Intensity (2/2) • Those pixels considered chromatic with an intensity below a threshold ThLare considered as black, thus preventing the instability of hue for low intensity. • High values will be considered as white when a pixel is achromatic.
Ohta Components • Low values for P1 and P2 are obtained when R, G, and B components are similar.
Edge-Detection Techniques • With this method, color information is not needed, and problems of color spaces can be prevented. • In [26], the authors reported that, while color provides faster focusing on searching areas, precision was lower due to confusion of colors. • Edge detection use only the brightness of the images to effect segmentation, using a Laplacian method. • Thus, methods based on shape analysis are more robust when changes in lighting occur. [26] M. Garcia-Garrido, M. Sotelo, and E. Martin-Gorostiza, “Fast traffic sign detection and recognition under changing lighting conditions,” in Proc. IEEE ITSC, M. Sotelo, Ed., 2006, pp. 811–816.
Edge-Detection Techniques • Canny method was used for edge detection since this method preserves closed outlines, which is a desirable characteristic in shapedetectionsystems. • Although they are simple and fast, they produce numerous candidate objects, which burden the detection and recognition steps with more work.
Edge-Detection Techniques - GER • Grayscale Edge Removal (GER) • This method was presented in [25] • Two-step secondorderderivative (Laplacian) method: • smoothing the image • applying a Laplacian filter • After this process, the result is an image called L(i, j). • T is the threshold, which is set as T = 3 as in [25]. [25] Y. Aoyagi and T. Asakura, “A study on traffic sign recognition in scene image using genetic algorithms and neural networks,” in Proc. 22nd IEEE Int. Conf. Ind. Electron., Control Instrum., Taipei, Taiwan, Aug. 1996, vol. 3, pp. 1838–1843.
Edge-Detection Techniques - Canny • The Canny edge-detection method [35]is commonly recognized [36] as a “standard method” used for comparison by many researchers. • Canny edge detection uses linear filtering with a Gaussian kernel to smooth noise and then computes the edge strength and direction for each pixel in the smoothed image.
Edge-Detection Techniques - CER • Color Edge Removal(CER) • This method measures the distance between one pixel and its 3 ×3 neighbors in the RGB color space. • Di,j is computed for each pixel • Those pixels with values below a given threshold are considered as belonging to the foreground
SVM Color Segmentation (SVMC) • Segmentation is a classification task. • Thus, segmentation can be carried out using any of the several well-known classification techniques. • One of these is the SVM, which provides some improvements over other classification methods • using color information. • The values obtained were γ = 0.0004 and C = 1000 for all the colors.
Speed Enhancement Using a LUT • Sometimes, a good segmentation algorithm cannot be used in a real application because of its slowness. • Making a pre-calculated lookup table to assign a color to each possible RGB value for speeding up. • The number of operations is thus reduced, but information are loss. • Three method are use LUT: HST, HSET, SVMC.
Outline • Introduction • System Overview • Segmentation Algorithms • Color Space Thresholding • Chromatic/Achromatic Decomposition • Edge-Detection Techniques • SVM Color Segmentation • Speed Enhancement Using a LUT • Experiment • Conclusion
Goal Evaluation • Many studies that measure segmentation performance [39]–[41], but none of them represents a standard. • This paper propose an evaluation method based on the performance of the whole recognition system. • Count the signs correctly recognized using different segmentation methods, whereas the rest of the system blocks remain unchanged.
Evaluated • Number of signs recognized • Global rate of correct recognition: • Number of lost signs: • Number of maximum: • False recognition rate: • Speed • All the measures were obtained in a Linux environment with a 2.6.27 kernel.
Achromatic Decomposition Methods (1/2) • First, it is necessary to ascertain whether the proposed achromatic decomposition methods are good enough. • only signs with white information are presented in the results.
Achromatic Decomposition Methods (2/2) • Based on these data, we decided to use the achromatic RGB Normalized and Ohtamethods in conjunction with its related color method and the SI achromatic method with color HST and HSET.
Color Segmentation Methods (1/2) • In this section, the data obtained for color plus achromatic methods are presented. And some of them use LUT to improves speed. • The data refer to all existing signs in the sets, including red, white, blue, and yellow data. • Two testing, first one use the same 29 signs as achromatic decomposition, second one use another 43 different signs.
Threshold Adjustment and Sensitivity • It may be exist better results with other parameters.
Tracking Results • A sequence of 7799 images recorded in mixed urban and road environments over 12 km with no relation to the images and sequences used in previous tests.
Outline • Introduction • System Overview • Segmentation Algorithms • Color Space Thresholding • Chromatic/Achromatic Decomposition • Edge-Detection Techniques • SVM Color Segmentation • Speed Enhancement Using a LUT • Experiment • Conclusion