Download
1 / 13
130 likes | 220 Views
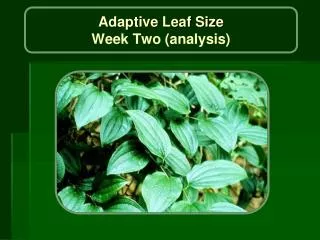
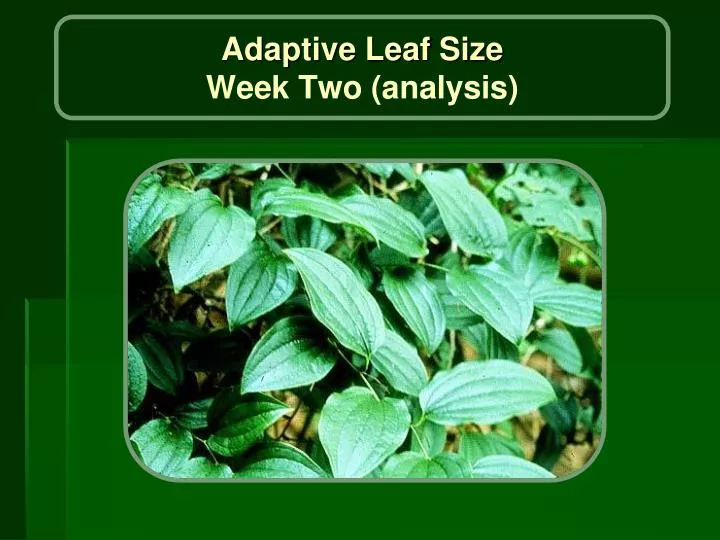
Adaptive Leaf Size Week Two (analysis). Hypotheses:. H 1 : Plants in wet soil do not have to conserve water, so they will be as warm as possible. H 2 : Plants in dry soil must conserve water, so they will be as cool as possible. Predictions :. Wet. Dry. Predictions:.

E N D
Hypotheses: • H1: Plants in wet soil do not have to conserve water, so they will be as warm as possible. • H2: Plants in dry soil must conserve water, so they will be as cool as possible. • Predictions :
Wet Dry Predictions: In the sun, a leaf can be warmed above the air temp by the sun, so this leaf should be large to increase photosyn.: stay hot In the sun, the air temp is the coolest the leaf can be, so this leaf should be small to reach air temp and conserve water: get cool Sunny In the shade, the leaf can get below air temp (due to evaporative cooling), so this leaf should be large to conserve water: stay cool In the shade, the air temp is as warm as the leaf can be, so this leaf should be the air temp to increase photosyn.: get hot Shady Decrease water loss Increase photosynthesis
Assumptions: • Temperature : Photosynthesis • Temperature : Water loss
We will do 4 t-tests • t-test: tells us how different the averages of two groups are • t-tests use Standard deviation (SD) • SD: “typical” deviation from the mean • t-tests give us a P-value • P-value: probability that your result is due to chance alone. • P ≥ 0.05 = the difference in averages is most likely due to chance… • P < 0.05 = the averages are “significantly” different • Don’t forget where you predicted the larger vs. smaller leaf! Fun with Statistics!
t-test… t = t-test value X = group mean s = st. dev. n = sample size
According to the model, what environmental factors determine leaf size? • What other environment factors could influence leaf size? • Why is the model applied to vine-like plants? • What assumptions did you make to test the model? • Do you think they were valid? • Which lab measurements were: • Qualitative? • Quantitative? Food for thought…
Wet Dry Sunny Shady
Wet Dry Sunny Shady Decrease water loss Increase photosynthesis
Wet Dry Sunny Shady Decrease water loss Increase photosynthesis
Wet Dry Sunny Shady Decrease water loss Increase photosynthesis
Wet Dry Sunny Shady Decrease water loss Increase photosynthesis
Wet Dry In the sun, a leaf can be warmed above the air temp by the sun, so this leaf should be large to increase photosyn.: stay hot In the sun, the air temp is the coolest the leaf can be, so this leaf should be small to reach air temp and conserve water: get cool Sunny In the shade, the leaf can get below air temp (due to evaporative cooling), so this leaf should be large to conserve water: stay cool In the shade, the air temp is as warm as the leaf can be, so this leaf should be the air temp to increase photosyn.: get hot Shady Decrease water loss Increase photosynthesis