Download

1 / 62
1.82k likes | 4.54k Views
Bioavailability and Bioequivalence. Bioavailability. Introduction Therapeutic effectiveness of a drug depends upon the ability of the dosage form to deliver the medicament to its site of action at a rate and amount sufficient to elicit the desired pharmacological response

E N D
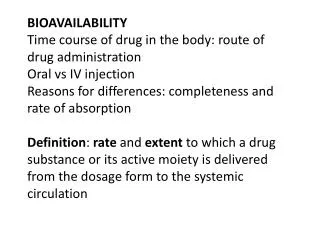
Introduction • Therapeutic effectiveness of a drug depends upon the ability of the dosage form to deliver the medicament to its site of action at a rate and amount sufficient to elicit the desired pharmacological response • This attribute of the dosage form is referred to as physiological availability, biological availability or bioavailability • It is defined as the rate and extent (amount) of absorption of unchanged drug from its dosage form.
Objectives of Bioavailability Studies • Primary stages of development of a suitable dosage form for a new drug entity to obtain evidence of its therapeutic utility • Determination of influence of factors affecting drug absorption • Development of new formulations of the existing drugs • Control of quality of a drug product during the early stages of marketing in order to determine the influence of processing factors, storage and stability on drug absorption • Comparison of availability of a drug substance from different dosage forms or from the same dosage form produced by different manufacturers
Drawbacks of Using Oral Solution as a Standard • Limits the pharmacokinetic treatment to one-compartment model only. It cannot applied two-compartment kinetics and all pharmacokinetic parameters cannot be assessed • Differentiation between the fraction of dose unabsorbed and that metabolized is difficult • If the rate of oral absorption is not sufficiently greater than the rate of elimination, the true elimination rate constant cannot be computed.
Single Dose versus Multiple Dose Studies(Preferred) • Accurately reflects the manner in which the drug will be used clinically • Easy to predict the peak & valley characteristics of drug since the bioavailability is determined at steady-state • Small inter-subject variability is observed in such a study which allows use of fewer subjects. Requires collection of fewer blood samples • Better evaluation of the performance of a controlled-release formulation is possible • Nonlinearity in pharmacokinetics, if present, can be easily detected
Limitations • Tedious (requires prolonged monitoring of subjects) requires more time to complete • Costly • Poor compliance by subjects • Greater exposure of subjects to the test drug, increasing the potential for adverse reactions • Human Volunteers—Healthy Subjects versus Patients • Study should be carried out in patients for whom the drug is intended, as they will be benefited from the study • Patients are generally preferred in multiple dose bioavailability studies
Advantages • Reflects better the therapeutic efficacy of a drug. • Drug absorption pattern in disease states can be evaluated • Avoids the ethical quandary of administering drugs to healthy subjects Disease, other drugs, physiologic changes, etc. may modify the drug absorption pattern • Disadvantages • Establishing a standard set of conditions necessary for a study is difficult with patients as volunteers • Such studies are therefore usually performed in young volunteers (20 to 40 years)
PHARMACOKINETIC METHODS • Based on the assumptions • Pharmacokinetic profile reflects the therapeutic effectiveness of a drug • Two dosage forms that exhibit superimposable plasma level-time profile or urinary excretion rate versus time result in identical therapeutic activity • Plasma Level—Time Studies • Single Dose • In single dose study blood samples are collected for 2 to 3 biological half-lives after drug administration • I.V dose sampling should start within 5 minutes of drug administration and subsequent samples taken at 15 minute intervals.
At least 3 sample points should be taken if the drug follows one-compartment kinetics & 5 to 6 points if it fits two-compartment model to describe disposition process • Oral dose at least 3 points should be taken on the ascending part of the curve for accurate determination of Ka • The points for disposition or descending phase of the curve must be taken in a manner similar to that for IV dose • Bioavailability is determined using Cmax, Tmax , AUC
The extent of bioavailability can be determined by following equations: [AUC]oral x [D] iv F = ------------------------------ [AUC]iv x [ D ]oral [ AUC]test *D std Fr= ------------------------------ [ AUC]std * Dtest where D stands for dose administered
Multiple Dose Studies • Drug administered for 5 biological half lives(time to reach the steady-state) • Dosing interval should be greater than or equal to biological half life. • A blood sample should be taken at the end of previous dosing interval and 8 to 10 samples after the administration of next dose. • The extent of bioavailability is given as Fr and τ is the dosing interval • [AUC]test Dstdτ test • Fr= ------------------------------ • [AUC]std Dtest τstd
Bioavailability can also be determined from the peak plasma concentration at steady-state Css,max according to following equation: (Css max)test Dstd τ test Fr = ------------------------------ (Css max)std Dtestτ std
Urinary Excretion Studies • It is based on the principle that the urinary excretion of unchanged drug is directly proportional to the plasma concentration of drug • Bioavailability using urinary excretion data is valid if at least 20% of administered dose is excreted unchanged in the urine • This is widely used for drugs extensively excreted in urine or if urine as site of action. • Method • Drug is administered to the patient • Collection of urine for 7 biological half lives
Analysis of unchanged drug • Determination of amount of drug excreted in each interval and cumulative amount of drug excreted • Estimation of bioavailability by urinary excretion method is shows high degree of variability & is less reliable than plasma studies. But is used in conjunction with blood level data for confirmatory purposes • Bioavailability can also be determined for a few drugs by assay of biologic fluids theophylline- salivary excretion , cephalosporin in CSF and bile
Plot of urinary excretion rate versus time. The curve is analogous to a typical plasma level-time profile obtained after oral administration (dXu/dt)max :Maximum urinary excretion rate & analogous to Cmax its value↑ rate & extent of Abs ↑ (tu ) max :Time for maximum urinary excretion rate. Analogous to Tmax. Xu: Cumulative amount of drug excreted in the urine
The extent of bioavailability is given by [Xu∞]oral D iv F = ----------------------- [Xu∞]iv D oral [Xu∞]test D std Fr = ------------------------- [Xu∞]std D test • Bioavailability multiple dose study at steady state is given by this equation where (Xu,ss) is the amount of drug excreted unchanged at steady-state (Xuss)testDstdτ test Fr= ------------------------- (Xuss)stdDtestτstd
Determination of Area Under the Curve (AUC) • It reflects the total amount of active drug which reaches the systemic circulation • [AUC] = F * D0/clearance • It is independent of route of administration and elimination process as long as it does not changes • AUC is directly proportional to dose • Planimeter • It consists of an arm attached to a rotating wheel which moves a dial with the movement of the arm. • The dial is equipped with vernier calipers to ensure accurate reading on the dial. The arm traces the curve to obtain the dial reading. • The reading is converted into the area by using a factor obtained by tracing the arm over a square of known area.
COUNTING SQUARES • Total number of squares enclosed by the plasma concentration-time curve, plotted on a regular rectilinear graph paper are counted • Graph paper containing 20 square/ linear-inch is used with a group of small squares that can be grouped together into few large squares • The area of each square is determined using relationship Area= (height)(width) with units of Conc. on Y-axis and time on X-axis. • Count the whole squares and squares that are 50% covered • AUC= (No. of squares) (area of one square)
Area of square A= (5.0mcg/mL)(0.5hr)= 2.5mcg.hr/mL Area of square B= (2.5mcg/mL)(0.25hr)= 0.625mcg.hr/mL Area of square C = (0.5mcg/mL)(0.05hr)= 0.025mcg.hr/mL
Trapezoidal Rule Method • In plasma Conc-time plot, the adjacent Conc data points are joined with straight lines and a perpendicular is drawn from these two concentration points to X-axis, one obtains a geometric figure • Since plot yields one or two triangles and the remaining figures tend to be trapezoids hence the name trapezoidal rule • The area of each segment is calculated by using formula • Area of triangle = (0.5) (height) (base) • Area of a trapezoid =(0.5) (base) (the sum of the two parallel sides)
Since a trapezoid is a triangle attached to a rectangle with a common base, its area can determined by • Area of a trapezoid = area of triangle + area of rectangle or in a simple way by the following formula • AUC = 0.5 (t2 – t1) (C1 + C2) + (t3 – t2) (C2 + C3) + ….. + (tn – tn-1) (Cn + Cn+1)
Cutting & Weighing • This method involves using two graphs one to plot the data another graph paper to be used as a reference • The graph papers used must be identical in all respects & scales used must also be identical. • The curve is then carefully cut and weight determined the weight of the curve is W1 & area AUC1 is proportional to the weight of graph paper • The area of the standard graph paper is calculated using the relationship • Area= (length) (height) • Ex. Y-axis Conc. (0 to 100 mcg/ml) & X-axis time (0 to 14 hours) then the area of this graph AUC2 is (100 mcg/ml) (14 hours) = 1400 mcg.hr/ml & its weight W2
Than the unknown area is determined using the following equation Integration Method In order to calculate AUC from time “t” to ∞ an integration of equation C = Co.e -kt with respect to time is carried AUC can be given by the following formula AUC = Co /K
PHARMACODYNAMIC METHODS Acute Pharmacological Response • PK methods are inaccurate or non-reproducible, acute pharmacological effect like ECG or EEG readings, pupil diameter, etc. is related to the time course of a given drug. • Bioavailability is determined by construction of pharmacological effect-time curve as well as dose-response graphs. • The method requires measurement of responses for at least 3 biological half-lives Disadvantages • The pharmacological response tends to be more variable and accurate correlation between measured response and drug Conc. is difficult. • Observed response may be due to an active metabolite whose concentration is not considered for the pharmacological effect.
Therapeutic Response Method • Method is based on observing the clinical response to a drug formulation given to patients suffering from disease for which it is intended to be used Limitations: • Improper quantification of observed response. • Assumes that physiological status of the patient does not change significantly over the duration of study. • A patient who required the drug for disease would be able to receive only single dose of drug every week or for a few days. • Drug -drug interaction.
In vitro dissolution alone will be insufficient to predict its therapeutic efficacy • Correlation between in-vitro dissolution & in-vivo bioavailability must be established to predict its therapeutic efficacy • IVIVC is mathematical model that describes the relationship between an in-vitro property (rate and extent of dissolution) of a dosage form and an in-vivo response (plasma drug concentration or amount of drug absorbed) • Objective of developing IVIVC is to enable the dissolution test to serve as a alternate for in vivo bioavailability studies
Applications • To ensure batch-to-batch consistency in therapeutic efficacy of a drug product based in vitro test • To develop a new dosage form with desired in-vivo performance • Validating dissolution specifications & development of bio- waiver guidelines • To estimate the magnitude of the error in predicting the in-vivo bioavailability results from in-vitro dissolution data
Approaches • Establishing a linear relationship between the in vitro and the in vivo parameters • Using data from previous in-vivo studies to modify the in-vitro to develop IVIVC • Correlations • Based on urinary excretion data: dissolution parameter are related to urinary drug parameters • Based on pharmacological response :acute pharmacological effect such as LD50 is related to any of the dissolution parameters. • Statistical moments theory: releate MDT to MRT
Based on the plasma level data : here linear relationship between dissolution parameter and plasma level data are established
LEVELS OF CORRELATION • Level A • Highest category correlation representing point- to- point relationship between in vitro and in- vivo parameters • In vitro dissolution & in- vivo absorption rate curves are superimposable • In vitro dissolution curve serves as a alternate for in vivo testing & can accurately predict its therapeutic efficacy • Level B • Not a point-to-point correlation utilizing principles of statistical moment analysis • Here mean dissolution time is compared to either the mean residence time or in vivo dissolution time.
Cannot justify changes in manufacturing or modification in formula based on level B correlation • In vitro data cannot be used for in-vivo quality control standards • Level C • It is a single point correlation. Relates one dissolution time point (T50%) to one PK parameter such as AUC, Tmax , Cmax • Useful as guide in formulation development or QC • Multiple level C • Correlation involving one or several PK parameter to the amount of drug dissolved at various time point
BCS drug for immediate–release drug products and IVIVC expectations
Equivalence: relative term that compares drug products with respect to a specific characteristic/function or a defined set of standards • Chemical Equivalence: two or more drug products contain the same active ingredient in the same amount • Pharmaceutical Equivalence: two or more drug products are identical in strength, quality, purity, content uniformity and disintegration and dissolution characteristics but may differ in terms of excipients used • Therapeutic Equivalence: two or more drug products that contain the same therapeutically active ingredient eliciting identical pharmacological effects and can control the disease to the same extent
Bioequivalence: Drug in two or more identical dosage forms reaches systemic circulation at the same relative rate and extent i.e. their plasma concentration-time profiles will be identical without significant statistical differences • Need/Objectives for Bioequivalence Studies • If a new product is intended to be a substitute for an approved medicinal product as a pharmaceutical equivalent/alternative • The equivalence with this product should be shown or justified in order to ensure clinical performance
TYPES OF BIOEQUIVALENCE STUDIES • In vivo • 1. Oral immediate release products with systemic action • Narrow therapeutic margin • Pharmacokinetics complicated by absorption, nonlinear kinetics, pre-systemic elimination • Unfavorable physiochemical properties, • Documented evidence for bioavailability problems • No relevant in vivo data available • 2. Non-oral immediate release products • 3. Modified release products with systemic action • Studies are conducted by Pharmcokinetic & Dynamic methods.
In vitro • Bio-wavers: In vitro studies, i.e., dissolution studies can be used as alternate to in vivo bioequivalence under certain circumstances • New drug product differs only in strength of the active substance it contains, provided all the following conditions hold • Pharmacokinetics are linear. • The qualitative composition is the same. • The ratio between active substance and excipients is the same or the ratio between the excipients is the same • Both products are produced by the same manufacturer at the same production site
The drug product has been slightly reformulated or manufacturing method, slightly modified without affecting bioavailability • The drug product meets all the following requirements • It is in solution or solubilized form • Active ingredient is in the same concentration as the approved drug product • The product contains no excipients that effect absorption of the drug • An acceptable IVIVC with similar in vitro dissolution rate as approved medicinal product • The product is intended for topical administration, oral administration but not intended to be absorbed
Experimental Study Design • The basic design for the study is determined by: • The scientific questions to be answered • The nature of the reference material and the dosage form to be tested, • The availability of analytical methods Benefit–risk & ethical considerations with regard to testing in humans. • Types of Design • Completely Randomized design. • Randomized Block design. • Repeated Measures, Cross over And Carryover designs. • Latin Square design.
Completely Randomized Design • All treatments are randomly allocated among all subjects. • Method of randomization: • Label all subjects with some number of digits(1-20) • Randomly select non repeating numbers from these labels • Subject them for the first treatment and then repeat for all other treatment • Advantages • Easy to construct. • Can done with number of treatments and subjects. • Simple to analyze with variable sample sizes for each treatment • Disadvantages is applicable limited treatments with homogenous subjects
Randomized Block Design • Subjects having similar background characteristics are formed as block • Treatments are randomized with in each block which are independent of each other • Advantages • Systemic way of grouping provide substantially more precise results unlike completely randomized design. • Treatments need not have equal sample size • The statistical analysis is relatively simple and design is easy to construct.