Download
1 / 12
120 likes | 248 Views
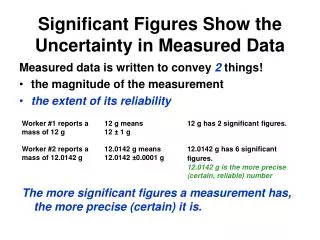
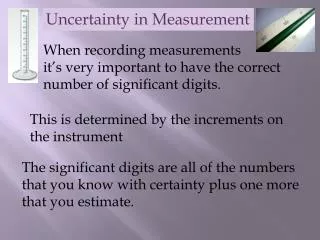
Uncertainty in Measured Quantities. Measured values are not exact Uncertainty must be estimated simple method is based upon the size of the gauge’s gradations and your estimate of how much more you can reliably interpolate statistical method uses several repeated measurements

E N D
Uncertainty in Measured Quantities • Measured values are not exact • Uncertainty must be estimated • simple method is based upon the size of the gauge’s gradations and your estimate of how much more you can reliably interpolate • statistical method uses several repeated measurements • calculate the average and the variance • choose a confidence level (95% recommended) • use t-table to find uncertainty limits • Propagation of uncertainty • Uncertainty in calculated values • when you use a measured value in a calculation, how does the uncertainty propagate through the calculation • Uncertainty in values from graphs and tables
Comparing a Measured Value (x) to aTheoretical or “Known” Value (Y) • Compute , the uncertainty in x, as already described • If (x - ) < Y < (x + ) • there is no significant difference between x and Y at the confidence level used to find . • Otherwise • x and Y are not equal at the confidence level used.
Comparing Two Measured Values • Suppose x was measured using two different instruments as an example • Approach #1 • find 1 and 2 as previously described • suppose x1 > x2 • then if (x2 + 2) > (x1 -1) there is no significant difference between the two at the confidence level used to find the uncertainties
Comparing Two Measured ValuesA Second Approach • Calculate tcalc • Look up ttable for (N1 + N2 - 2) degrees of freedom at the desired confidence level • There is no significant difference between the two values if
Uncertainty in Values Read from Graphs • Suppose x was measured or calculated and now y is being determined • Note that low and high are not equal • My personal preference is to take whichever is larger and use it as both the low and high uncertainty
Uncertainty from Charts with Parameters • Suppose x and p were measured or calculated and y is now desired • Method shown is a worst case uncertainty • assumes maximum of both errors • errors often offset each other
Uncertainty in Values from a Table • As before,low and high are not equal
Error Propagation in Calculations • Suppose x, y, and z were measured (or calculated from other measured values) • this means the uncertainty for each is known • Now want to calculate A which is a function of these measured values • also want to know the uncertainty in the calculated value of A • A = f(x,y,z)
Error Propagation • For infinitesimal errors (dx, dy, and dz) • Assuming the errors are small enough that the partials of f are not affected, the actual errors (A, x, y and z) can be substituted for the infinitesimal ones (dA, dx, dy, and dz)
Errors aren’t known; Uncertainties are known • The uncertainties are the maximum values of the errors, not the actual errors • It is likely that some errors will cancel each other out • and that most errors will be smaller than the maximum • Square both sides of the previous equation, then average over all possible errors (assuming a normal distribution)
Formula for Uncertainty in a Calculated Value • Resulting equation for Uncertainty: • Example: Suppose a cylinder has a radius of 3.3 ± 0.1 cm and a length of 10.8 ± 0.2 cm. What is its volume and what is the uncertainty in that volume?