Download
1 / 1
10 likes | 123 Views
STRUCTURAL STATE OF PLAGIOCLASE FROM ANORTHOSITIC XENOLITHS IN THE BEAVER BAY COMPLEX, NORTHEASTERN MINNESOTA, USA

E N D
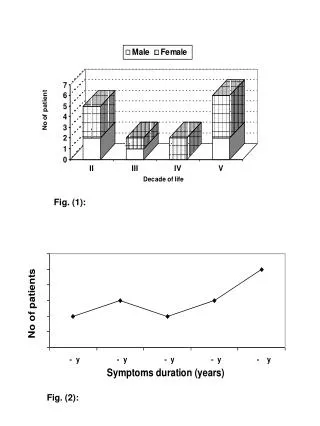
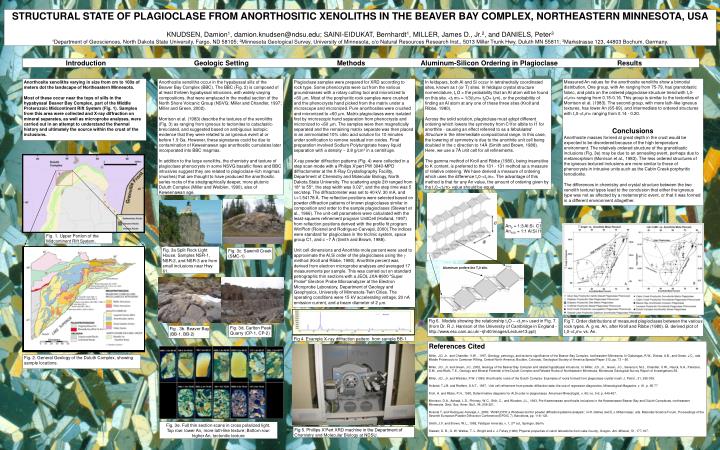
STRUCTURAL STATE OF PLAGIOCLASE FROM ANORTHOSITIC XENOLITHS IN THE BEAVER BAY COMPLEX, NORTHEASTERN MINNESOTA, USA KNUDSEN, Damion1, damion.knudsen@ndsu.edu; SAINI-EIDUKAT, Bernhardt1, MILLER, James D., Jr.2, and DANIELS, Peter31Department of Geosciences, North Dakota State University, Fargo, ND 58105; 2Minnesota Geological Survey, University of Minnesota, c/o Natural Resources Research Inst., 5013 Miller Trunk Hwy, Duluth MN 55811; 3Markstrasse 123, 44803 Bochum, Germany. Introduction Geologic Setting Methods Aluminum-Silicon Ordering in Plagioclase Results Measured An values for the anorthosite xenoliths show a bimodal distribution. One group, with An ranging from 75-79, has granoblastic fabric, and plots on the ordered plagioclase structure trend with t10-<t1m> ranging from 0.15-0.16. This group is similar to the tectonites of Morrison et al. (1983). The second group, with more lath-like igneous textures, has lower An (65-69), and intermediate to ordered structures with t10-<t1m> ranging from 0.14 - 0.20. Conclusions Anorthosite masses formed at great depth in the crust would be expected to be disordered because of the high temperature environment. The relatively ordered structure of the granoblastic inclusions (Fig. 3e) may be due to an annealing event, perhaps due to metamorphism (Morrison et al., 1983). The less ordered structures of the igneous textured inclusions are more similar to those of phenocrysts in intrusive units such as the Cabin Creek porphyritic ferrodiorite. The differences in chemistry and crystal structure between the two xenolith textural types lead to the conclusion that either the igneous type was not as affected by a metamorphic event, or that it was formed in a different environment altogether. Anorthosite xenoliths varying in size from cm to 100s of meters dot the landscape of Northeastern Minnesota. Most of these occur near the tops of sills in the hypabyssal Beaver Bay Complex, part of the Middle Proterozoic Midcontinent Rift System (Fig. 1). Samples from this area were collected and X-ray diffraction on mineral separates, as well as microprobe analyses, were carried out in an attempt to understand the thermal history and ultimately the source within the crust of the inclusions. Anorthosite xenoliths occur in the hypabyssal sills of the Beaver Bay Complex (BBC). The BBC (Fig. 2) is composed of at least thirteen hypabyssal intrusions, with widely varying compositions, that were emplaced in the medial section of the North Shore Volcanic Group (NSVG; Miller and Chandler, 1997; Miller and Green, 2002). Morrison et al. (1983) describe the textures of the xenoliths (Fig. 3) as ranging from igneous to tectonites to cataclastic-brecciated, and suggested based on ambiguous isotopic evidence that they were related to an igneous event at or before 1.9 Ga. However, these signatures could be due to contamination of Keweenawan age anorthositic cumulates later incorporated into BBC magmas. In addition to the large xenoliths, the chemistry and texture of plagioclase phenocrysts in some NSVG basaltic flows and BBC intrusives suggest they are related to plagioclase-rich magmas (mushes) that are thought to have produced the anorthositic series rocks of the stratigraphically deeper, more plutonic Duluth Complex (Miller and Weiblen, 1990), also of Keweenawan age. Plagioclase samples were prepared for XRD according to rock type. Some phenocrysts were cut from the various groundmasses with a rotary cutting tool and micronized to <60 m. Most of the porphyritic rock samples were crushed and the phenocrysts hand picked from the matrix under a microscope and micronized. Pure anorthosites were crushed and micronized to <60 m. Matrix plagioclases were isolated first by microscopic hand separation from phenocrysts and micronized to <60 m. The samples were then magnetically separated and the remaining matrix separate was then placed in an ammoniated 10% citric acid solution for 10 minutes under sonification to remove residual iron oxides. Final preparation involved Sodium Polytungstate heavy liquid separation with a density ~ 2.8 g/cm3 in a centrifuge. X-ray powder diffraction patterns (Fig. 4) were collected in a step scan mode with a Philips X’pert PW 3040-MPD diffractometer at the X-Ray Crystallography Facility, Department of Chemistry and Molecular Biology, North Dakota State University. The scattering angle 2 ranged from 18° to 55°, the step width was 0.02°, and the step time was 5 sec/step. The diffractometer was set to 40 kV, 30 mA, and =1.54178 Å. The reflection positions were selected based on powder diffraction patterns of known plagioclases similar in composition and order to the sample plagioclases (Stewart et al., 1966). The unit-cell parameters were calculated with the least-squares refinement program UnitCell (Holland, 1997) from reflection positions derived with the profile fit program WinPlotr (Roisnel and Rodriguez-Carvajal, 2000).The indices were standard for plagioclase in the triclinic system, space group C1, and c ~7 Å (Smith and Brown, 1988). Unit cell dimensions and Anorthite mole percent were used to approximate the Al,Si order of the plagioclases using the method (Kroll and Ribbe, 1980). Anorthite percent was derived from electron microprobe analyses and averaged 17 measurements per sample. This was carried out on standard petrographic thin sections with a JEOL JXA-8900 "Super Probe" Electron Probe Microanalyzer at the Electron Microprobe Laboratory, Department of Geology and Geophysics, University of Minnesota-Twin Cities. The operating conditions were 15 kV accelerating voltage, 20 nA emission current, and a beam diameter of 2 m. In feldspars, both Al and Si occur in tetrahedrally coordinated sites, known as t (or T) sites. In feldspar crystal structure nomenclature, t1O = the probability that an Al atom will be found on this site. <t1m> = 1/3(t1m+ t2O+ t2m), or the probability of finding an Al atom at any one of these three sites (Kroll and Ribbe, 1980). Across the solid solution, plagioclase must adopt different ordering which lowers the symmetry from C1for albite to I1 for anorthite - causing an effect referred to as a Modulated Structure in the intermediate compositional range. In this case, the lowering of symmetry is due to the anorthite unit cell being doubled in the c direction to 14Å (Smith and Brown, 1988). Here, we use a 7Å unit cell for all refinements. The gamma method of Kroll and Ribbe (1980), being insensitive to K content, is preferred to the 131 - 131 method as a measure of relative ordering. We have derived a measure of ordering which uses the difference t10-<t1m>. The advantage of this method is that for any An value, the amount of ordering given by the t10-<t1m> value should be equal. An0 = 1:3 Al:Si C1 An100 = 1:1 Al:Si I1 Fig. 1. Upper Portion of the Midcontinent Rift System. Fig. 3a Split Rock Light House. Samples NSR-1, NSR-2, and NSR-3 are from small inclusions near Hwy 61. Fig. 3c. Sawmill Creek (SMC-1) Aluminum prefers the T10 site. Fig 6. Models showing the relationship t1O – <t1m> used in Fig. 7. (from Dr. R J. Harrison of the University of Cambridge in England -http://www.esc.cam.ac.uk/~rjh40/images/Lecture13.ppt) Fig 7. Order distributions of measured plagioclases between the various rock types. A. g vs. An, after Kroll and Ribbe (1980). B. derived plot of t10-<t1m> vs. An. Fig. 3d. Carlton Peak Quarry (CP-1, CP-2) Fig . 3b. Beaver Bay (BB-1, BB-2) Fig 4. Example X-ray diffraction pattern from sample BB-1 References Cited Miller, J.D. Jr. and Chandler, V.W. , 1997, Geology, petrology, and tectonic significance of the Beaver Bay Complex, northeastern Minnesota. In Ojakangas, R.W., Dickas, A.B., and Green, J.C., eds. Middle Proterozoic to Cambrian Rifting, Central North America: Boulder, Colorado, Geological Society of America Special Paper 312, pp. 73 – 96. Miller, J.D., Jr. and Green, J.C., 2002, Geology of the Beaver Bay Complex and related hypabbysal intrusions, in: Miller, J.D., Jr., Green, J.C., Severson, M.J., Chandler, V.W., Hauck, S.A., Peterson, D.M., and Wahl, T.E., Geology and Mineral Potential of the Duluth Complex and Related Rocks of Northeastern Minnesota, Minnesota Geological Survey Report of Investigations 58. Miller, J.D., Jr. and Weiblen, P.W. (1990) Anorthositic rocks of the Duluth Complex: Examples of rocks formed from plagioclase crystal mush. J. Petrol., 31, 295-339. Holland, T.J.B. and Redfern, S.A.T., 1997, Unit cell refinement from powder diffraction data: the use of regression diagnostics. Mineralogical Magazine, v. 61, p. 65-77 Kroll, H. and Ribbe, P.H., 1980, Determinative diagrams for Al,Si order in plagioclases. American Mineralogist, v. 65; no. 5-6; p. 449-457. Morrison, D.A., Ashwal, L.D., Phinney, W.C., Shih, C., and Wooden, J.L., 1983, Pre-Keweenawan anorthosite inclusions in the Keweenawan Beaver Bay and Duluth Complexes, northeastern Minnesota. Geol. Soc. Amer. Bull., 94, 206-221. Roisnel T. and Rodriguez-Carvajal J., 2000. “WinPLOTR: a Windows tool for powder diffraction patterns analysis”, in R. Delhez and E.J. Mittenmeijer, eds. Materials Science Forum, Proceedings of the Seventh European Powder Diffraction Conference (EPDIC 7), Barcelona, pp. 118–123. Smith, J.V. and Brown, W.L., 1988, Feldspar minerals, v. 1, 2nd ed., Springer, Berlin. Stewart, D. B., G. W. Walker, T. L. Wright and J. J. Fahey (1966) Physical properties of calcic labradorite from Lake County, Oregon. Am. Mineral., 51, 177-197. Fig. 2. General Geology of the Duluth Complex, showing sample locations. Fig. 3e. Full thin section scans in cross polarized light. Top row: lower An, more lath-like texture; Bottom row: higher An, tectonitic texture Fig 5. Phillips X’Pert XRD machine in the Department of Chemistry and Molecular Biology at NDSU.