Download
1 / 20
210 likes | 349 Views
Contribution of Satellite Laser Ranging results to Lunar Laser Ranging analysis. Journées 2005 Systèmes de Référence Spatio-Temporels “Earth dynamics and reference systems: five years after the adoption of the IAU 2000 Resolutions”. Warsaw, 19-21 September 2005.

E N D
Contribution of Satellite Laser Ranging results to Lunar Laser Ranging analysis. Journées 2005 Systèmes de Référence Spatio-Temporels “Earth dynamics and reference systems: five years after the adoption of the IAU 2000 Resolutions” Warsaw, 19-21 September 2005 S. Bouquillon, J. Chapront & G. Francou
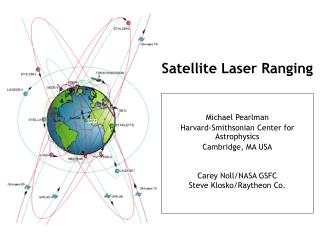
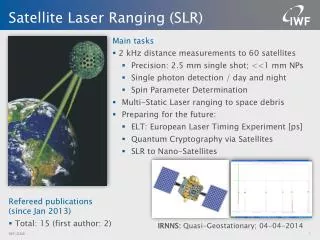
Laser Ranging Techniques Satellite • t0 (emission date) • t1 (reception date) => distance (Earth-Satellite-Earth) ≈ t/c≈(t0-t1)/c Lageos
Laser Ranging Techniques Moon • t0 (emission date) • t1 (reception date) => distance (Earth-Moon-Earth) ≈ t/c≈(t0-t1)/c
Laser Ranging Techniques Moon’s retro-reflectors Lunakhod 1 (lost) Lunakhod 2
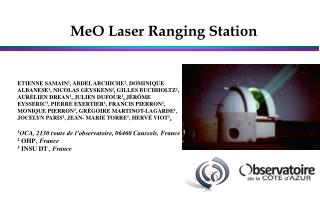
Laser Ranging Stations (ILRS) Satellite laser ranging station Lunar laser ranging station Grasse Fort-Davis
Position Time Series of Grasse Station (Coulot et al., 2003)* * D. Coulot, P. Berio, P.exertier, O. Laurain: SF2A-2003: Semaine de l'Astrophysique Française, Conference Series, p. 51.
Analysis of Position Time Series of Laser station of Grasse Frequencies Analysis (FAMOUS) X = 0.00211 + 0.00119*t – 0.00336*cos( x ) – 0.00391 *sin( x ) Period of x = 1.0324 (± 0.0249) years ( Signal/Noise =4.7) ---------------------------------------------------------------------------------------------------------------------------------------------- Y = 0.00190 + 0.00147*t – 0.00403*cos( y ) – 0.00159*sin( y ) Period ofy = 0.9944 (± 0.0251) years( Signal/Noise =4.0) ---------------------------------------------------------------------------------------------------------------------------------------------- Z = 0.01343 - 0.00003*t – 0.00694*cos( z ) – 0.00263*sin( z ) Period ofz = 1.0584 (± 0.0694) years( Signal/Noise =4.9) Model 1 Weighted Least Squares MODEL 2 X = 0.00104 + 0.00173*t – 0.00357*cos( ) – 0.00353 sin( ) ---------------------------------------------------------------------------------------------------------------------------------------------- Y = 0.00327 + 0.00103*t – 0.00399*cos( ) – 0.00100*sin( ) ---------------------------------------------------------------------------------------------------------------------------------------------- Z = 0.01385 - 0.00057*t – 0.00517*cos( ) – 0.00415*sin( ) Period of fixed to one year Model 2 (t in years from J2000)
Models for Position Time Series of Laser Station of Grasse Model 1 Model 2
Position Time Series of Grasse Station in « Local Reference Frame » Zenith (m) (m) (m) West South
One year Signal in Lunar Laser Ranging O-C (Grasse station) Position of Grasse Station : ITRF 2000 (O-C)an = 0.02266 – 0.01028*t – 0.00913*cos( ) + 0.00139*sin( ) Period of .0510 (± 0.0140) years ( Signal/Noise =3.06) Position of Grasse Station : ITRF 2000 + MODEL 1 (O-C)an = 0.02570 – 0.00843*t – 0.01224*cos( ) – 0.00508*sin( ) Period of = 1.0358 (± 0.0088) years ( Signal/Noise =3.62)
One year Signal in Lunar Laser Ranging O-C (Grasse station) Position of Grasse Station : ITRF 2000 (O-C)an = 0.02266 – 0.01028*t – 0.00913*cos( ) + 0.00139*sin( ) Period of .0510 (± 0.0140) years ( Signal/Noise =3.06) Position of Grasse Station : ITRF 2000 + MODEL 2 (O-C)an = 0.02522 – 0.00836*t – 0.01218*cos( ) – 0.00565*sin( ) Period of = 1.0228 (± 0.0084) years ( Signal/Noise =3.73)
Position Time Series of Fort Davis Station (Coulot et al., 2003)* * D. Coulot, P. Berio, P.exertier, O. Laurain: SF2A-2003: Semaine de l'Astrophysique Française, Conference Series, p. 51.
Analysis of Position Time Series of Laser Station of Fort-Davis Frequencies Analysis (FAMOUS) X = 0.00026 – 0.00256*cos( x1 ) – 0.00114 *sin( x1 ) Period of x1 = 1.6933 years ( Signal/Noise = 4) – 0.00251*cos( x2 ) + 0.00116*sin( x2 ) Period of x2 = 0.5064 years ( Signal/Noise = 3.64) --------------------------------------------------------------------------------------------------------------------------------------------------------------- Y = 0.00636 + 0.00578*cos( y1 ) – 0.00221*sin( y1 ) Period ofy1 = 2.2079 years( Signal/Noise = 7.13) + 0.00193*cos( y2 ) – 0.00459*sin( y2 ) Period ofy2 = 1.3266 years( Signal/Noise = 5.7) – 0.00359*cos( y3 ) Period ofy3 = 0.9596 years( Signal/Noise = 3.5) --------------------------------------------------------------------------------------------------------------------------------------------------------------- Z = 0.01364 – 0.00237*cos( z1 ) – 0.00434*sin( z1 ) Period ofz1 = 1.5321 years( Signal/Noise = 3.5)
Model for Position Time Series of Laser Station of Fort-Davis
Position Time Series of Fort-Davis Station in « Local Reference Frame » Zenith West South
CONCLUSION Justification of this analysis: Position times series of laser stations (Coulot et al.) and Lunar Laser Ranging (LLR) observations are gotten with * the same instruments (Grasse and Fort-Davis instruments), * the same laser ranging technique , * and during the same period of time (between 1993-2005). The amplitudes of variations of positions of laser stations are important (for Grasse : around 2 cm). This first analysis shows that: Taking into account of local variations of Laser Stations do not improve the RMS of LLR residus because of larger effects not-well modelized as * Lunar Librations, * Orientations of Reflectors, * Atmosphere effects * ... One result: The time’s derivative coefficient of LLR residus (O-C) is improved (reduced of 2mm/years) between 1998-2004 by taking into account of Coulot’s series.