Download
1 / 39
390 likes | 547 Views
Minimalism in Sensor Networks. Subhash Suri UC Santa Barbara and ETH Zurich. Moving from Big to Small. Today : Few, big, powerful, global sensors. Tomorrow : many small, weak, local sensors. Pervasive computing, sensing, monitoring, actuation.

E N D
Minimalism in Sensor Networks Subhash Suri UC Santa Barbara and ETH Zurich
Moving from Big to Small Today: Few, big, powerful, global sensors Tomorrow: many small, weak, local sensors Pervasive computing, sensing, monitoring, actuation. Challenge: compose global picture from local data
Some Applications • Structural monitoring (civilian, industrial infrastructure faults) • Agriculture (soil moisture, pesticide levels) • Environmental monitoring (wildfires, hazmat) • Habitat monitoring (Great Duck Island, UCB Redwoods) • Surveillance (target tracking, border policing) How to achieve large scale with mote-caliber devices?
B (x,y) A Scale Requires Minimalist Design • Scaling in Space (size) • Sensors have small coverage area (e.g., bio or chemical) • Large areas must be covered • Large deployments must be automated • Minimalist network protocols • Location-based naming and addressing • Geographical routing (e.g. GPSR, GLIDER)
Scaling in Time • Sensor nodes have limited battery life • On/off scheduling and power management • Need minimalist models of energy consumption • Processing/communication tradeoffs • transmit/compute cost ratio > 1000 • TinyDB, Cougar style in-network processing • Lightweight algorithms for lifetime maximization • Today’s Talk [IPSN 2005] • Minimalist self-monitoring • Detect large network failures • Joint work with Shrivastava and Toth
Scaling in Functionality • Need minimalist sensing models • Small, inexpensive, noisy, failure-prone micro-sensors • Simple broadly applicable architectures • Fundamental limits of performance • Today’s Talk [ACM SenSys ‘06] • Tracking with binary proximity sensors • Sensors detect presence or absence of target • How well can a target be tracked? • Joint work with Shrivastava, Mudumbai, Madhow
Monitoring the Network Health • Deployment conditions for sensor can be harsh and adversarial: need to remotely monitor the overall health of the network. • Continuously monitoring state of each sensor too expensive: need lightweight mechanisms. • Focus on significant damage to the network: large network disconnection. • -cut: partition where fraction of sensors are cut off from the rest. • Sensors embedded in physical space, so significant failures often spatially correlated.
Linear Cuts and a Minimalist Model Base Station • Linear -cut: partition by a line. • Base station: a distinguished node. • Assume linear cut disconnects -fraction of sensors from the base. • Designate a small number of nodes as sentinels, and track only their health. • Minimalist Model: • Each sentinel sends to the base station a bit to indicate it is alive; absence of bit indicates death. • Separation of routing from the monitoring. • How many sentinels needed to detect every linear -cut? A linear cut
Sampling and VC-dimension • O(1/ log 1/) size random sample is an -net with prob 1-. • A related problem studied by Kleinberg: detect -cuts in wired network caused by failure of k edges or nodes. • Kleinberg shows this set system has VC dimension poly(k), and so number of sentinels is poly(k, 1/, 1/). • Improved bounds and variations in A. Gupta and Fakcharoenphol. • However, these methods give 1-sided guarantees: every -cut is detected, but not every cut found is necessarily an -cut. • False positives in (remote) sensor networks can be a major nuisance. • The -approximation is not scalable: requires (d/ log 1/) nodes. • Is it possible to do scalable, minimalistic monitoring with the 2-sided guarantee?
Desiderata • Cuts must be defined as a fraction of the network size. • Otherwise, catching all cuts of size k requires at least n/k sentinel nodes. • Sharp threshold impossible as well: catch all -cuts, but no cuts of size < n. • Such a sharp cutoff requires at least n/2 sentinel nodes. 0 1 n-1 2 n-2 k
Main Result • Theorem: A sentinel set of size O(1/) that deterministically detects every -cut, and every reported cut has size at least n/2.
Geometry of Network Cuts • Think of sensors as points in the plane. • A linear cut is a line that partitions the point set. • The point-line duality: point (a,b) <-> line y = ax - b q (1,2) p* L q* p L* (1,0) • It inverts the above/below relationship: point p above line L <-> point L* above line p*
Geometry of Network Cuts L Cut • L is an -cut if the dual point L* lies above n dual lines: • set of all linear -cuts is the region above the n level (symmetrically, below the (n - n) level). • Imagine a polygonal curve (separator) made up of dual lines that lies between n/2 and n levels: • primal points corresponding to these lines form a sentinel set. • Two issues: • Is there such a separator using just a few lines? • We don't know the cut line L. How will we decide that L* lies above the separator? L* Level 0
Complexity of a Separator • A level can have size (nlogn). • Average complexity of a level is (n). • We want a separator of size roughly 1/ (independent of n!). • Fact: Total size of first k levels is O(nk). • We can choose two levels a and b s.t. • Each has size O(n), and • |b - a| (n).
Complexity of Separator • Construct a zig-zag path between levels a and b: • Start at left, follow the edge until top level hit. • Reflect and follow until bottom level hit, reflect and continue. • These paths are edge-disjoint. • Total number of bends at most the number of vertices in the top and bottom levels. • By the pigeon-hole principle, at least one of the O(n) paths has O(1/) segments. • The dual points of these lines are our sentinels.
Detecting Cuts from Sentinels • Base station stores the arrangement formed by the separator lines • For each dead (live) sensor, we know that L* must be above (below) the line. • Intersection of these halfspaces a convex cell. • If this cell is above the separator, we declare an cut. • Otherwise, it's a false alarm. • In this example, w1, w3, w4 are dead; others alive.
Cut Detection Guarantee • Separator lies below level n, so if intersection cell below it, must be smaller than a cut. • Separator lies entirely above level nso if intersection cell above it, must be at least a (cut.
Simulation Results US-census data N = 5000, = 0.01 No. of Sentinels = 12 Uniform N = 5000, = 0.01 No. of sentinels = 14 Non-uniform N = 5000, = 0.01 No. of sentinels = 14
Scalability with Network Size e = 0.01
Scalability with N = 5000
k-random directions Sentinels vs. Random Sampling • Two natural random sampling schemes. • Choose as many random nodes as our sentinel schemes. • Random Sampling • k nodes chosen uniformly at random. • Report if more than k sentinels dead. • Radial Sampling • k directions chosen at random, and for each choose the en extreme vertex. • Report if any of these k dies.
False Positives • Generated 250 cuts by picking points randomly between levels 1 and n/2 • These cuts are all below the appr threshold, and should not be reported. • Random and radial sampling schemes misreport some of them as cuts. No False Positives in Sentinel Set
False Negatives • 250 cuts by picking points randomly between level n and 2n • These are all above the approximation threshold, and so should be reported. • Random and radial sampling schemes failed to report some of them as cuts. No False Negatives in Sentinel Set
Target Tracking with Binary Sensors • Minimalist model • Single bit output: presence/absence of target. • No information about position, distance, angle etc. • Idealization: perfect detection, circular range. • Simple, broadly applicable, robust model • Appropriate for large-scale deployments (e.g., ExScale project at OSU) • Fundamental limits of network sensing • Spatial resolution • Minimal path descriptions • Efficient geometric algorithms
The Geometry of Binary Sensing Sensor Outputs Target Path Localization patches
Target Localization • Sensing output is a binary vector. Ex. F2 = (1,1,0). • Each vector localizes the target to a localization patch. • The accuracy (max error) of localizationis function of the size of localization patches. • What are the minimalist parameters to study this?
Tracking Resolution Theorem • sensor density (#sensors per unit area) • R: sensing radius • Theorem:If sensors have sensing radius R and the field has sensor density then the target can be tracked with spatial resolution (1/Rand this is the best possible. • Cor: In d-space, the resolution is O(1/Rd-1)
Upper Bound on Attainable Resolution • Consider 2 concentric circles C1 (radius R) and C2 (radius 2R), with center x. • Only sensors in C2 can detect a target in C1. • Assume C2 has avg sensor density, so at most N = (4R2) sensors in it. • N sensing ranges form N2-N+2 patches. • At least one of these patches must have area >= (R2)/N2 = (1/2R2). • Worst-case localization accuracy is the diameter of this patch.
Achieving the Resolution • Uniform placement of sensors in a grid achieves the resolution (1/R). • Geometric and probabilistic analysis shows the same bound for uniform random distribution.
Localizing a Trajectory • Target localized to a time-ordered sequence of patches. • Any path inside this “tube” is within the resolution guarantee. • What is a good representative path?
OccamTrack: Minimal Representation • Use Occam’s principle of minimal representation. • Geometric algorithm computes polygonal path of minimum • number of line segments through the resolution tube.
Spatial Low Pass Filtering • Sensors act like a low pass filter. • Local rapid variations invisible. • Estimating velocity: • only average across patches. • Target localized to a 1-dim arc at sensor boundary crossings. • Interpolate the velocity across multiple patches. • Velocity estimation reliable only over long path segments • Minimal representation helps again!
Velocity Estimation Theorem: To achieve relative velocity error , length of approximating segments must be L is the spatial resolution (patch size). For 10% error, L 5; for 5% error, L 6.32
Simulation Results: Path Representation Weighted Centroid Output (Kim et al, IPSN 2005) 1000 vertices OccamTrack Output 50 vertices
Fundamental Resolution Limits Theoretical resolution attained by both regular and random deployment
Lab-Scale Mote Experiment Non-ideal sensor response Particle Filter OccamTrack OccamTrack with ideal sensing Particle Filter + Geometric
Research Problems • Network monitoring • More general failure models • Large but not total failure • Location based routing • 3-dimensional networks • Tracking • Beyond idealized sensing • Multiple targets
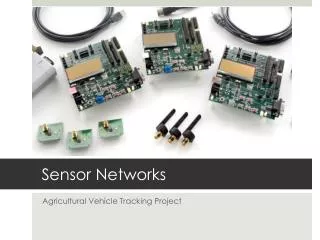
Sensor Nodes: Motes • Lightweight tiny devices, run on batteries Mica motes with light, acoustic, acceleration sensors