Download
1 / 22
220 likes | 351 Views
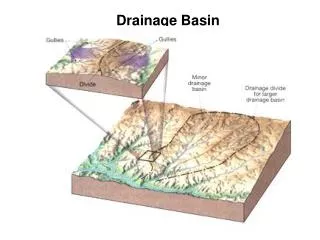
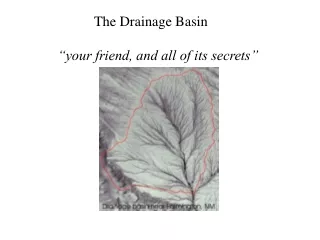
Baseline Deposition Rates, Lead-Rich Sediment, Coeur d’Alene (CdA ) River Floodplain, Idaho Arthur Bookstrom, Stephen Box, Robert Fousek. Mill tailings and floods in the CdA drainage basin, Lead-rich sediments on the CdA River floodplain, Baseline rates of sediment deposition,

E N D
Baseline Deposition Rates, Lead-Rich Sediment, Coeur d’Alene (CdA) River Floodplain, IdahoArthur Bookstrom, Stephen Box, Robert Fousek • Mill tailings and floods in the CdA drainage basin, • Lead-rich sediments on the CdA River floodplain, • Baseline rates of sediment deposition, • Baseline concentrations of lead (Pb) in sediments, • Secondary sources of Pb-rich sediment, • Continuing deposition of Pb-rich sediments.
1933 Flood Smelterville Flats, Idaho Rose Lake, Idaho
Section of Pb-Rich Sediments 1980 Mt. St. Helens volcanic ash layer Riverbank near Medimont in 1993 Base of section of Pb-rich sediments
Pre- and Post-1969 Rates of Sediment Deposition in Medicine Lake
Summary of Baseline Depositional Rates and Lead Concentrations
Baseline Depositional Rates 1.8 3.0 7.4
Lateral Variation in Baseline Rates of Sediment Deposition 28.5
Baseline Lead Concentrations 1500 2800 4500
Box plots of historic and baseline sediment-deposition rates 40 n = 46 n = 46 35 30 25 SEDIMENT-DEPOSITION RATE (CM/10Y) 20 90th percentile 15 75th 10 4.7 50th 5 3.6 25th 10th 0 sdrBA (~1903 - 1980) sdrAA (1980 ~1993) Figure 17. Box-and-whisker plots, comparing sediment-deposition rates for sediments of the historic (BA) and baseline (AA) time-stratigraphic intervals.
Box plots of Pb concentrations in sediments of successive time intervals 16000 14000 12000 10000 INTERVAL-WTD AVERAGE LEAD (PPM PB) 8000 6000 4000 2000 0 PbBA1 (1968 - 1980) PbAA (1980 ~1993) n = 13 n = 13 90th percentile 75th 4000 50th 3300 25th 10th Figure 23. Box-and-whisker plots, comparing interval-weighted average lead (ppm Pb) in sediments of the early post-tailings-release (BA1) and baseline (AA) time-stratigraphic intervals.
Percentages of tailings-derived Pb in sediments by drainage basin, and by depositional setting
1996 Scour of Pb-Rich Sediments in the River near Dudley Approximate location of drill hole 94VCD2 River bottom before 1996 flood Sandy active bed sediment (poorly stratified) Scoured zone Stored Pb-rich sediments (well stratified) Log exposed by flood scour
’96 scour Secondary Sourcesof Pb-Rich Sedimentin the River Channel