Download
1 / 12
120 likes | 214 Views
Average Height. By: Jasmine Vollmer. Data. 5’ 3’’ 5’ 4’’ 6’ 3’’ 4’ 11.5’ 5’ 5’’ 5’ 8’’ 5’ 6’’ 5’ 1.5’’ 5’ 11’’ 6’ 5’ 5’ 9’’ 5’ 1’’ 5’ 9’’ 5’ 7.5’’ 5’ 2’’ 6’ 2’’ 5’ 11’’ 5’ 3’’ 5’ 5’’ 5’ 9’’ 6’ 5’5’’ 5’ 7’’ 5’ 4.5’’ 5’ 5’’ 5’ 8’’ 5’ 7’’ 5’3’’ 6’ 2’’ 5’

E N D
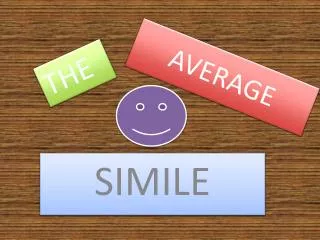
Average Height By: Jasmine Vollmer
Data 5’ 3’’ 5’ 4’’ 6’ 3’’ 4’ 11.5’ 5’ 5’’ 5’ 8’’ 5’ 6’’ 5’ 1.5’’ 5’ 11’’ 6’ 5’ 5’ 9’’ 5’ 1’’ 5’ 9’’ 5’ 7.5’’ 5’ 2’’ 6’ 2’’ 5’ 11’’ 5’ 3’’ 5’ 5’’ 5’ 9’’ 6’ 5’5’’ 5’ 7’’ 5’ 4.5’’ 5’ 5’’ 5’ 8’’ 5’ 7’’ 5’3’’ 6’ 2’’ 5’ 5’ 7.5’’ 5’ 4’’ 5’ 1.5’’ 5’ 3’’ 5’ 4’’ 5’ 8’’ 5’ 2’’ 5’ 5’’ 5’ 7’’ 6’ 1’’ 5’ 10’’ 5’ 5’’ 5’ 5’ 2’’ 5’ 4’’ 5’ 7’’ 5’ 3’’ 5’ 10’’ 5’ 8’’
Frequency of heights Height Frequency 4' 11.5’’ 1 5' 3 5' 1'‘ 1 5' 1.5'‘ 2 5' 2'‘ 3 5' 3'‘ 5 5' 4'‘ 4 5' 4.5'‘ 1 5' 5'‘ 6 5' 6'‘ 1 5' 7'' 4 5' 7.5‘ 2 5' 8'‘ 4 5' 9'‘ 3 5' 10'‘ 2 5' 11'‘ 2 6' 2 6' 1'‘ 1 6' 2'‘ 2 6' 3'' 1
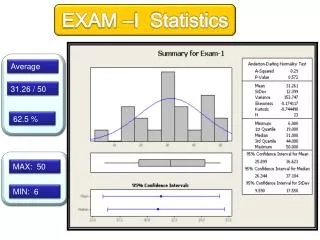
Median • The median is 5’ 5’’ • The median is the middle variable in a set if data
Mean • The mean of the data is 5’ 6’’ • To get the mean you add up all the data and then divide the total up by the number of data
Range • The range of the data is 1’ 3.5’’ • To get the range you subtract the minimum value from the maximum value
Mode • The mode of the data collected is 5’ 5’’ • Mode is the most popular or most frequent variable in a set of data
Standard Deviation • To get the S.D. on a calculator you press the stat button then enter. Next you enter all your data and press stat again. You move the arrow over one and press enter and that gives you the S.D. • S.D. measures the variation of data from the mean. • The standard deviation is 0.3244
Frequency of Heights Frequency Heights
Five Number Summary Minimum: 4’ 11.5’’ Quartile 1: 5’ 3’’ Median: 5’ 5’’ Quartile 3: 5’ 8’’ Maximum: 6’ 3’’
Box and Whisper 5’ 1’’ 5’ 3’’ 4’ 11’’ 5’ 5’’ 5’ 7’’ 5’ 9’’ 5’ 11’’ 6’ 1’’ 6’ 3’’
Conclusion • My conclusion is that most people are between 5’ 3’’ – 5’ 8’’ and the most common height is 5’ 5’’