Download
1 / 73
2.82k likes | 4.49k Views
Fault Tree Analysis. Fault Tree Analysis. Used in both reliability engineering and system safety engineering Developed in 1961 for US ICBM program Guide published in 1981 Used in almost every engineering discipline Not a model of all system or component failures.

E N D
Fault Tree Analysis • Used in both reliability engineering and system safety engineering • Developed in 1961 for US ICBM program • Guide published in 1981 • Used in almost every engineering discipline • Not a model of all system or component failures
Applying Fault Tree Analysis • Postulate top event (fault) • Branch down listing faults in the system that must occur for the top event to occur • Consider sequential and parallel or combinations of faults • Use Boolean algebra to quantify fault tree with event probabilities • Determine probability of top event
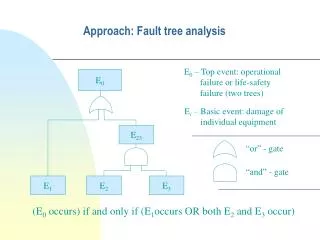
Fault Tree Logic • Use logic gates to show how top event occurs • Higher gates are the outputs from lower gates in the tree • Top event is output of all the input faults or events that occur
Terms • Faults and failures • System and subsystem faults • Primary and secondary failure • Command fault
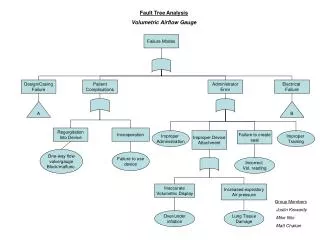
Primary Event Symbols Gate Symbols AND Basic Event OR Conditioning Event Exclusive OR Undeveloped Event Priority AND External Event Inhibit Intermediate Event Symbol Transfer Symbols Transfer IN Transfer OUT Fault Tree Symbols
Fault Tree Symbols Primary Event Symbols Basic Event Conditioning Event Undeveloped Event External Event
AND OR Exclusive OR Priority AND Inhibit Fault Tree Symbols Gate Symbols
Fault Tree Symbols Intermediate Event Symbol Transfer Symbols Transfer IN Transfer OUT
No Current A B C Switch A Open Battery B 0 Volts Union A=B + C A=B Union C B OR C must occur for event A to occur
Over-heated Wire D E F 5mA Current in System Power Applied t >1ms Intersection D=E * F D= E Intersection F E AND F must occur for D to occur
Fault Tree Quantification • Fault tree analysis - is not a quantitative analysis but can be quantified • How to • Draw fault tree and derive Boolean equations • Generate probability estimates • Assign estimates to events • Combine probabilities to determine top event
Fault Tree Example Outlet Valve Relay K1 Pressure Switch S Relay K2 Pressure Tank Switch S1 Timer Relay Motor Pump
Common Mistakes inFault Trees • Inputs with small probabilities • Passive components • Does quantified tree make sense • Don’t fault tree everything • Careful with Boolean expressions • Independent Vs dependent failure modes • Ensure top event is high priority
Non-Safety Tools • Failure Modes, Effects, and Criticality Analysis • Human Factors Analysis • Software Safety Analysis
FMEA • Reliability engineering tool • Originated in 1960s • OSHA recognized • Limitation - failure does not have to occur for a hazard to be present in system • Used to investigate how a particular failure can come about
Define system & analysis scope Construct block diagrams Assess each block for effect on system List ways that components can fail Assess failure effects for each failure mode Identify single point failures Determine corrective actions Document results on worksheet FMEA Process
System Breakdown Subsystem 1 Subsystem 2 Subsystem 3 Assembly 1 a Assembly 1 b Assembly 1 c Subassembly 1c.1 Subassembly 1c.2 Subassembly 1c.3 Component 1c.3.1 Component 1c.3.2 Component 1c.3.3 Total System Part 1c.3.3.a Part 1c.3.3.b Part 1c.3.3.c
FMEA Worksheet • Component #, name, function • Failure modes • Mission phase • Failure effects locally • Failure propagation to the next level • Single point failure • Risk failure class • Controls, recommendations
Failure Modes • Premature operation • Failure to operate on time • Intermittent operation • Failure to cease operation on time • Loss of output or failure during operation • Degraded output or operational capability • Unique failure conditions
Failure Modes, Effects, & Criticality Analysis • Virtually same as FMEA • Identifies criticality of components • Emphasizes probability of failure • Criticality components • Failure effect probability • Failure mode ratio • Part failure rate • Operating time
Human Factors Safety Analysis • Many different techniques • Human element must be considered in engineering design • The merging of three fields: • Human factors • Ergonomics • Human reliability
Performance & Human Error • Why do people make mistakes? • Combination of causes - internal/external • Performance shaping factors (factors that influence how people act) • External PSF • Internal PSF • Stressor PSF
Human Error • Out of tolerance action within human/machine system • Mismatch of task and person • Significant contributor to many accidents • False assumptions • Human error is inevitable • People are careless • More complex systems must be less dependent on how well people operate them
Human Error Categories • Omission - leaving out a task • Commission • Selection error • Error of sequence • Time error • Qualitative error
HF Safety AnalysisThe Process • Describe system goals and functions • List & analyze related human operations • Analyze human errors • Screen errors & select • Quantify errors & affect on system • Recommend changes to reduce impact of human error
Software Safety • Newest member of system safety field • Software controls millions of systems • Treat software like any system component • Determine the hazards • If software is involved in hazard - deal with it • Common tools • Software Hazard Analysis • Software Fault Tree Analysis • Software Failure Modes & Effects
Software Facts • Software is not a hazard • Software doesn’t fail • Health monitoring of software only assures it performs as intended • Every line of code cannot be reviewed • Fault tolerant is not the same as safe • Shutting down a computer may aggravate a an already dangerous situation
Software Safety Analysis (SSA)Flow Process • Software Requirements Development • Top-level System Hazards Analysis • Detailed Design Hazard Analysis • Code Hazard Analysis • Software Safety Testing • Software User Interface Analysis • Software Change Analysis
SSA Required when software is used to: • Identify a hazard • Control a hazard • Verify a control is in place • Provide safety-critical information or safety related system status • Recovery from a hazardous condition
Safety Tool Categories • Software safety requirements analysis • Flowdown analysis • Criticality analysis • Architectural design analysis • Detailed design analysis • Soft tree analysis • Petri-Net • Code analysis
Software Testing • Software testing • System safety testing • Software changes • IV &V organization
MORT • Qualitative tool used in 1970s • Merges safety mgt & safety engineering • Analyses mgt policy in relation to RA and hazard analysis process • Uses a predefined graphical tree • Analyze from top event down • Too large and doesn’t tailor well to smaller problem
Energy Trace Barrier Analysis (ETBA) • Qualitative tool for hazard analysis • Developed as part of MORT • Traces energy flow into, through, & out of system • Four typical energy sources • Energy transfer points & barriers analyzed • Advantages
ETBA Procedure • Examine system / identify energy sources • Trace each energy source through system • Identify vulnerable targets to energy • Identify all barriers in energy path • Determine if controls are adequate
Sneak Circuit Analysis • Standardized by Boeing in 1967 • Formal analysis of all paths that a process could take • Find sneak paths, timing, or procedures that could yield an undesired effect • Review engineer drawings, translate, & identify patterns • Disadvantages
Cause-Consequence Analysis • Uses symbolic logic trees • Determine accident or failure scenario that challenges the system • Develop a bottom-up analysis • Failure probabilities calculated • Consequences identified from top event • Consequence may have variety of outcomes
Dispersion Modeling • Quantitative tool for environmental and system safety engineering • Used in chemical process plants, can determine seriousness of chemical release • Internationally recognized model - CAMEO • Features of the system • Advantages
Test Safety • Not an analysis technique • Assures safe environment during testing • Must integrate system safety process into test process • Three layers of test environment • Safety analysis needed at each level • Test readiness review
Comparing Techniques • Complex Vs simple • Apply to different phases of system life cycle • Quantitative Vs qualitative • Expense • Time and personnel requirements • Some are more accepted in certain industries
Selecting A Technique • All techniques are good analyses • Consider advantages and disadvantages • Select technique most suited to the problem, industry, or desired outcome • Ask yourself a few questions • What’s the purpose? • What is the desired result? • Does it fit your company and achieve goals? • What are your resources and time available?
Data Reliability • Start with company historical data • Analyses only as good as the data that is used • Caution about misunderstanding data • Quantifiable data is not always the best • Always cite sources and assumptions
Data Limits • Most failure data is generic • Break large items into smaller parts • Data may not consider environmental changes • Use expert judgement to convert generic data into realistic values
Government Data Banks • Government Printing Office • Books from DoD, NASA, EPA, & OSHA • Government-Industry Data Exchange Program • Army, Navy, FAA, Dept of Labor, Dept of Energy, National institute of Standards and Technology • Databases of other countries
Industry Data Banks • Corporations • Insurance companies • Electronics Industries Associations • Consumer Product Commission • System Safety Society • Material Safety Data Sheets
Creating Your Own Databank • Collect data on system • Design • Assessments • Hazard identification • Compliance verification • Make the data easily accessible and consolidated in one place • Computers and new software make collection easier
Hazardous materials MSDS System design info Safety critical systems Best design practices Testing history Failure history Safety analyses Accident histories Safety Standards Identified hazards Causes of hazards Proven hazard controls Hazard consequences Hazard tracking system Data Bank Systems Info System Safety Data