Download
1 / 39
390 likes | 549 Views
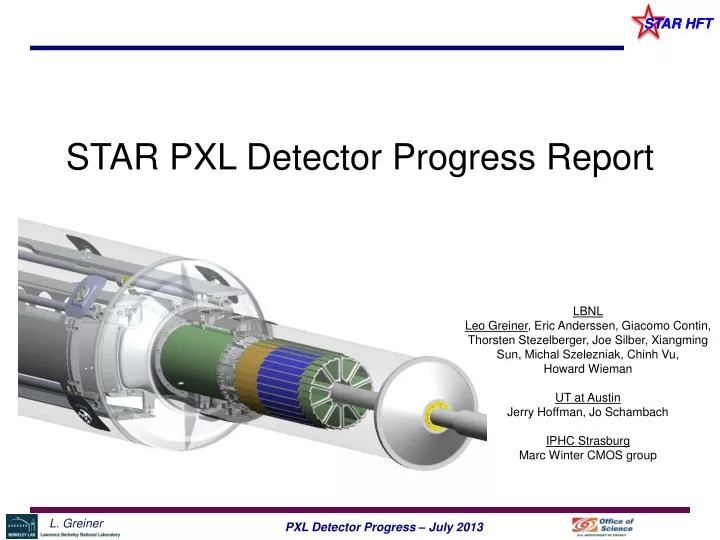
STAR PXL Detector Progress Report. LBNL Leo Greiner , Eric Anderssen, Giacomo Contin, Thorsten Stezelberger, Joe Silber, Xiangming Sun, Michal Szelezniak, Chinh Vu, Howard Wieman UT at Austin Jerry Hoffman, Jo Schambach IPHC Strasburg Marc Winter CMOS group. Talk Outline.

E N D
STAR PXL Detector Progress Report LBNL Leo Greiner, Eric Anderssen, Giacomo Contin, Thorsten Stezelberger, Joe Silber, Xiangming Sun, Michal Szelezniak, Chinh Vu, Howard Wieman UT at Austin Jerry Hoffman, Jo Schambach IPHC Strasburg Marc Winter CMOS group
Talk Outline • Detector assembly, integration and installation for engineering run. • Engineering Run results and lessons learned. • Progress on sensor production, thinning probe testing and yield. • Progress on production of final detector. • Timeline for installation in run 14.
Assembling sensors into ladders – Assembly Reference pins for cable/sensor alignment • We use precision vacuum chuck fixtures to position sensors and assemble ladders. • Sensors are positioned manually with butted edges. Acrylic adhesive mechanically decouples sensors from the cable and prevents CTE difference based damage. • Weights taken at all assembly steps to track material and as QA.
Assembling sensors into ladders – Assembly • Hybrid cable with carbon fiber stiffener plate on back in position to glue on sensors. • The cable reference holes are used for all aspects of assembly of ladders and sectors.
Completed PXL ladder Completed ladder in anti-static carrying box with follower and check off list.
Ladders to sectors Sector in optical metrology machine • Sensor positions on sector are measured and related to tooling balls. • After touch probe measurements, sectors are tested electrically for damage from metrology.
sectors to detector half • Sectors are mounted in dovetail slots on detector half. • Metrology is done to relate sector balls to each other and to kinematic mounts.
PXL insertion mechanics Interaction point view of the PXL insertion rails and kinematic mount points Carbon fiber rails Kinematic mounts
PXL insertion mechanics PXL detector half with complete insertion mechanism
Engineering Run Left detector half being inserted Right detector half being inserted
Engineering Run PXL eng detector inserted, cabled and working in 1 day access
PXL engineering run statistics • Installation of 3 sector engineering detector on May 8, 2013. Run ended June 10, 2013. • 510 GeV p-p running • 2 weeks to get detector integrated with DAQ, slow controls, trigger, online monitoring, offline event processing. Set up initial thresholds and bias settings. • PXL tracking data requires low multiplicity. Data taken during short (~1 hr) periods at the end of RHIC fills. • Approximately 10 M events in low multiplicity environment. (trigger >10 multiplicity in TOF) • ~600 GB of low multiplicity PXL data. • ~ 180 GB high multiplicity PXL data (taken late in run at high prescale value to minimize PXL data rate)
Installed sectors Measured ~ 1 week after first beam. There were only 5 bad sensors before installation.
Offline event displays Hit pattern on sensor over one run Possible heat issue?
Offline event displays Raw hits/sensor For 2 sectors Inner Ladder (1) shows ~ 4 times as many hits as outer ladders.
Offline event displays Correlation plot for TPC track pointing to outer PXL ladder (shows pointing resolution of un-calibrated TPC) Sector hit display
Latch-up and SEU (high luminosity) • DATA SET 1: June 8, 2013 (10 hours) • DATA SET 2: June 9, 2013 (5hrs) only sector 2 and 7, luminosity was only ⅛ of the nominal value; • DATA SET 3: Third data set: June 9, 2013 (4hrs) only sector 2 and 7, sensors in pattern mode Latch-up Data Summary Latch-up events were observed only on the digital power supply (no latch ups on the analog power supply nor in the MTB.)
Latch-up and SEU SEU is measured as corrupted sensor JTAG configuration registers and as corrupted data from pattern registers. Summary of SEU count in DATA SET 1: • These are only JTAG register errors. • Memory errors tested by pattern mode sensor output are still under analysis.
Selected Lessons Learned Mechanical • Sector mechanical conflict in the inner ladder driver boards. • Fixturing and sector tube fabrication process. Electrical • Power issues (already discussed) • Diode temperature measurement.
Sector Driver board conflict • Driver board mechanical conflict. • We ran with sectors in non adjacent positions for the engineering run. • Sector tube and inner driver board have been re-designed. • Inner ladder boards are now all low profile components. • Sector tubes made smaller to increase inner layer radius to beamline. (~3mm) new
Sector tubes and assembly fixturing • Sector tube steps – inner radius is too shallow and stress fractures the sensor in the upper corner during the gluing process. • Fixturing for assembling ladders to sectors had an oversized cutout for surface component clearance. This gave an unsupported section at the end of ladder with the edge of the support behind the edge of the last sensor. This would fracture the sensor during the gluing process.
Diode temperature measurement • Each sensor has a integrated temperature sensing diode. • The diode is located as shown and is in a “hot” area of the sensor. • The cathode is brought out to a bonding pad whilst the anode is internally wired to sensor ground. Buffers Temperature sensor DACs
Diode temperature measurement Silicon bandgap temperature sensor: The response is ~ 2 mV / degree C Problem: The ground potential at the various locations of the ladder fluctuates depending on the current draw of the sensors on the ladder which depends on the occupancy and other factors. The effect of this fluctuation is larger than the expected diode response. Solution: We measure the temperature using a 100 µA current source and a I2C ADC on the MTB for 2 sensors per ladder. We will modify the circuitry (one wire patch) to allow us to measure the ground potential on the sensor being measured. This will result in only measuring one temperature per ladder unless we add another ADC to the MTB and another patch wire. Suggestion for future: bring both anode and cathode of the diode to bonding pads for flexibility.
Other issues • Tracking with PXL hit points is not yet completed. • TPC calibration needs to be done to allow for tracking and efficiency measurements. • Possible radiation damage to sensors, under investigation. (beam excursions / dumps after installation could have damaged sensors as some stopped working after the detector was inserted) • The automated threshold setting scripts worked but we need to update this for the full detector. • We discovered some sensors that had problems, even when probe tested. We need to carefully map probe testing error modes and properly propagate this to the selection process. • Efficiency measurements based on integrating the correlation function plots is a work in progress. The method is approximate at best and currently yields 60-70% efficiency. • Some oscillations were seen with the remote sense voltage regulators for the ladders before installation (despite working fine at LBNL). We modified to local sense but this may have caused other problems (low supply voltage?, VCLP,) This, along with current draw, will be investigated after the detector returns to LBNL.
In progress From Hao Qiu on July 4, 2013
Progress in production • Sensor yield • Aluminum cable ladders • Status of production readiness • Schedule for production
Mechanical thinning yield for DRIE • We have been working with Aptek industries for back thinning and polishing of DRIE trenched wafers. • These are the results of the first batch of 25 wafers from AMS. • Visual microscope inspection for chips, cracks, etc. • The processing method for DRIE wafers is being fine tuned, but appears to be good now. • The yield for the most recent batch thinning of 13 wafers was 99.2 %. We expect this result to be representative for further processing. • The cost of thinning 25 wafers whilst preserving wafer position information is $6375 ($1200 for preserving wafer position) Overall yield 87%
Automated interface to a database (18 config + 68 result parameters) Sensors are binned according to performance PXL Sensor selection Example of wafer maps for Ultimate-2 wafers with DRIE processing (ion etching) ~65% - 70% yield
Aluminum cable ladder • First Al cables from CERN PCB shop. • Needed rework to allow wire bonding. • Validated through bonding, soldering and resistance (voltage drop) testing to allow fabrication of batch to meet schedule. • The first cable loaded with sensors is shown below. • Testing is beginning. • Based on schedule, only the inner ladders will be fabricated on Al conductor cables for the run 14 detector.
Status of PXL production parts 25 wafers of sensors in hand 40 Cu cables loaded in hand 100 outer driver boards in hand 40 inner driver boards arrive in July 20 Al conductor cables ship July 1 Ladders Fine wire cables 25 in hand – production in progress 10 in hand Possible minor modification Full production in August timeframe. Non-critical path MTBs
Status of PXL production parts All cables in hand Half modified to be non magnetic VHDCI Cables 5 production motherboards in hand. Design validated in engineering run Tested for use with SSD. Order balance in the next 2 weeks. PXL (SSD) motherboard
Status of PXL production parts Re-design in progress Fabrication in August timeframe Sector tubes D-tubes Insertion mechanics Minor modifications to existing New pieces in August timeframe • The effort is geared to the first production detector to be installed for run 14. The spare detector will follow. • Other pieces – power supplies, TCD interfaces, control PCs, etc. are in hand.
Simplified Production Schedule • March 2013: • Deliver the engineering run detector to BNL. P installed in May • Aluminum conductor cable fabrication begins. P begun in June • April 2013: • Re-design as needed for mechanical and/or electrical changes based on eng run experience. P • Fabricate parts for mechanical. – in progress • Place RDO board orders. – non critical path, to be done in the next 2 weeks • Production sensors arrive, test and send out for thinning and dicing. P • May-June 2013: • Production dicing and thinning. P • Production ladder assembly. in progress • Final electronics fabricated – non critical path, in progress • Mechanical assembly of detector parts. – now scheduled for July - August • July-August 2013: • Sector assembly – now scheduled for August-September • Metrology - now scheduled for September • Final detector assembly – Now scheduled for late September • September 2013: • Delivery of primary PXL detector – now scheduled for early October
Assembling sensors into ladders – Assembly Assembled ladder on FR-4 handling piece Early optimization Testing results (ladder with 2 bad sensors) Sensor noise performance only minimally degraded with all sensors running
Offline event displays Hits per cluster 3-4 (Measured 2.5 hits/cluster for normal incidence beam test 120 GeV pions.)