Download
1 / 13
130 likes | 242 Views
A Stochastic LCA Framework for Embodied Greenhouse Gas Analysis. Dr David Shipworth School of Construction Management and Engineering University of Reading - UK. Objectives. Model effect of policies encouraging low carbon technologies (e.g. Carbon taxes & Emission Trading)

E N D
A Stochastic LCA Framework for Embodied Greenhouse Gas Analysis Dr David ShipworthSchool of Construction Management and EngineeringUniversity of Reading - UK
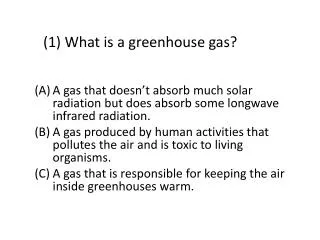
Objectives • Model effect of policies encouraging low carbon technologies (e.g. Carbon taxes & Emission Trading) • Avoid misrepresentation of single ‘average’ CO2eq figures for materials • To capture lost information (variance, skewness, etc) • Model the ‘carbon diversity’ of materials
Requirements of model • Stochastic: • Require probability distributions of embodied CO2eq in materials • Complete: • Incorporate the system boundary completeness of Input-Output (IO) with the product specificity of Process Analysis (PA) (a ‘hybrid’ model) • Evolutionary: • Model to support progressive integration PA data as and when it becomes available
Data Sources • UK National Environmental Accounts (UKNEA) • 91 sector IO accounts • Aggregated for environmental homogeneity • UK National Atmospheric Emissions Inventory (NAEI) • ~4400 emissions estimates by economic sector, source and fuel (thousand tonnes) for C, CH4 & N2O • Includes non-fuel emission sources • UK Annual Business Inquiry (ABI) • Total purchases data for 3-digit sub-sectors at basic prices • Existing process analysis data • Anonymous, process level data by UKNEA sector
Components of model:Expanded UKNEA • UKNEA is 91x91 Environmental I-O matrix • Transaction between sectors is in £M • Annual emissions vectors allow conversion to emissions flows (T.CO2eq) or intensities (T.CO2eq/£M) • Each sector contains between 0 and 9 SIC 3-digit sub-sectors • Expanding to sub-sectors creates 91 by 161 (2-digit by 3-digit) matrix
Components of model:Expanded UKNEA • New column totals available from ABI • New 3-digit sub-sector row transaction totals are existing 2-digit transaction values • 2-digit sales to 3-digit sub-sectors reconstructed using GME method • Product can be viewed either as: • a 91 by 161environmental IO table; or • a 91x91 IO table with cells containing multi-state data
Components of model:Emissions Intensities • Use ~4400 NAEI data for C, CH4 & N2O • Allocate to SIC 3-digit (161) sub-sectors based on primary sector definitions • Gives total emissions from 3-digit sub-sector • Use ABI data to convert to emissions intensities (T/£M) at the 3-digit level
Components of model:Bayesian Prior • Apply 3-digit sub-sector emissions intensities to reconstructed transaction values between 2-digit sectors and 3-digit sectors • This gives Dirichlet emissions intensity distribution within each 2-digit sector • The number of states of the Dirichlet distribution equals number of 3-digit sub-sectors
Components of model:Process Analysis Data • Use anonymous process level data • Data collected by UK ETS sector level entrants • System boundary is UKNEA sector definition • Data expressed as T.CO2eq/£M • Represent data as multinomial distribution
Integrate prior I-Odistribution (Dirichlet), with process data process distribution (Multinomial) Done using Markov Chain Monte Carlo package (WinBUGS) Resulting ‘Posterior’ distribution is most heavily influenced by the stronger data set New data can continually be integrated Components of model:Bayesian integration
The UKNEA in graph theory terms • The UKNEA is a 91 sector (node) deterministic graph • Connected sectors are linked by a single pathway (edge) • The I-O matrix is the ‘adjacency’ matrix of this graph – a value in a cell indicates a pathway between sectors • Each pathway has an emissions intensity • Total emissions into a sector are found by tracing back along the carbon pathways • The pathways create a carbon ‘tree’ for that sector
The Model in graph theory terms • The Model is a 91 sector stochastic graph • Connected sectors are linked by one or more pathways • The expanded I-O matrix is the ‘adjacency’ matrix of this graph – a distribution in a cell indicates multiple pathways between sectors • The distributions combine prior I-0 data integrated with process analysis data on an ongoing basis
The Model in graph theory terms • Each of the pathways has a different emissions intensity • Total emissions into a sector are found by tracing back along the carbon pathways – where there are multiple pathways one is chosen at random • The set of all possible pathways creates a carbon ‘forest’ for that sector • The carbon diversity of the forest is the carbon diversity of the sector