Download
1 / 63
650 likes | 958 Views
RTI Team Problem Solving. Team Structure Team Process: IDEAL. Debbie Oliver, RTI Coordinator Adapted from Montana Office of Public Instruction Linda McCulloch, Superintendent www.opi.mt.gov. Problem Solving. • Uses scientific method • Data feedback loop • Data-based decision making

E N D
RTI Team Problem Solving Team Structure Team Process: IDEAL Debbie Oliver, RTI Coordinator Adapted from Montana Office of Public Instruction Linda McCulloch, Superintendent www.opi.mt.gov
Problem Solving • Uses scientific method • Data feedback loop • Data-based decision making – Eliminates bias – Takes subjectivity out of decisions • Can be applied regardless of “presenting problem”
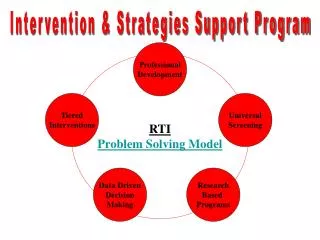
RTI Team Structure INTENSIVE LEVEL Specific Strategies related to student factors (RTI Problem Solving Team) • Great RTI Teams • Have experience & expertise • • Have knowledge about curriculum & classroom • Management • •Identify and access training when needed • • Represent diverse groups & grade levels Intensive 5% Strategic STRATEGIC LEVEL Standard Protocol Instructional Response – (RTI Problem Solving Team) 15 CORE 85% CORE LEVEL (Grade Level Teams)
Problem Solving Team Roles Facilitator Case Manager/ Case Worker Time keeper Recorder (Scribe) Selected team members with expertise in – curriculum – classroom management – medical/health – behavior – special education Referring teacher Grade Level Representatives
Remembering the Basics Maintain confidentiality. Hold meetings in a timely manner (within two weeks of referral) Display agenda during meeting Set clear time limits. Be responsive to staff and student needs. Access and use auxiliary personnel and other appropriate resources. Have members that represent a variety of experience and expertise: knowledge of classroom management, curriculum and instruction, and student motivation. Continue to stretch and grow.
Problem Solving Team Meeting • Include the case worker (someone from RtI Team) • Adhere to agenda/role responsibilities • Define area of concern • Develop strategies & interventions • Define responsibilities • school, parent, teacher, student • Schedule follow-up meeting (4-9 weeks) • Share Responsibility
Critical Features of Problem Solving • Data…data….data = Data-driven decision making • Problem Solving is: – Outcome focused – Data-driven – Links assessment to intervention – Context specific
The IDEALProblem Solving Process(RBM, Idaho; Callendar 2004) • I - Identify the Problem • D - Define the Problem • E- Explore Intervention Options • A- Act on the Intervention Plan • L - Look at Results
I- Identify the Problem A “problem” is a general statement about a student’s presenting concern • Review Data: School records, Teacher records, State/District Assessments, Work samples, Portfolios, Interviews, CBMs (AIMSweb probes), Observations • Discuss collaboratively • Define the behavior • Consider the impact of each domain of the problem: the Learner, the Instruction, the Curriculum, and the Environment • Evaluate what’s been already tried • Identify why the problem is occurring
Problem= What is Expected Actual Performance • Example = (Expectation: Expect Johnny to read 60 WPM with 0 errors) 60 WPM with 0 Errors 33 WPM with 5 Errors (Actual Performance:Johnny Reads 33 WPM with 5 Errors)
I– Component:Behavioral Definition Write a behavioral definition of the “problem” • Uses words to describe observable behavior • Use action verbs that are observable • Examples of observable action verbs: • write • read orally • fill in • underline • Examples ofnon-observable action verbs: • develop • think • know • recognize • solve • learn • Gives examples and non-examples
I– Component:Behavioral Definition Format ______________________ means that _________________________ (name of behavior) (name of learner) ________________________________________________________ (Action verbs describing what the learner is doing) Examples include:__________________________________________ (describe what is to be counted) Non Examples include:______________________________________ (describe what is not acceptable to count)
Sandy – A Practice Scenario • Sandy is a third grade student who is struggling in reading. Her reading rate is slow as she struggles with sounding out words. • Concern/behavior: – Reading fluency is much lower than her peers
Sandy’s Behavioral Definition Poor reading (sounding out words)means that (name of behavior) Sandy (name of learner) reads a median of 12 WPM compared to a class median of 112 WPM (Action verbs describing what the learner is doing) Examples include: correct words per minute WPM (describe what is to be counted) Non Examples include: recognize sight words (describe what is not acceptable to count)
D- Define the Problem Components: • Measurement Strategy – a procedure used to collect individual performance data. • Present Level of Performance (PLOP) -describes an individual’s baseline level of performance in a target behavior (academic or behavioral) at a specific point in time [Example: Currently, Jeffrey can read 45 WPM with 4 errors which is at the 10th percentile compared to his peers. Students his age are expected to read at a rate of 100 WPM with 3 errors to achieve performance at the 50th percentile] • Problem Analysis
Characteristics of GoodMeasurement Strategy • Systematic • Reliable • Valid (Concurrent, predictive, treatment) • Regular and frequent analysis of performance over time • Simple to use • Time-efficient
Sandy’s Behavioral Definition Decisions Grid Decision 2 What materials will be used/needed to collect the data? Decision 1 How will data be collected? Progress monitoring 2 x week AIMSweb probes Decision 3 Where (setting) will we collect the data? Decision 4 Who will be responsible for collecting the data? In regular classroom Classroom teacher
Benefits of Collecting PLOP Data • Provides a benchmark/baseline against which subsequent performance can be compared. • Helps to set challenging, achievable goals that compare the individual to him/herself. • Compare the individual with other standards: – Peer expectations – Teacher expectations – School rules/expectations – Performance standards (CBMs)
4 Steps for describing PLOPs • 1. Collect baseline data • 2. Summarize that data • 3. Choose a performance standard • 4. Evaluate your data
Step 1: Collect Data • Behavioral definition to define what we will measure, – e.g. “Reading” • Choose a measurement strategy, – e.g. (event) words read correctly • Collect enough data to be – Stable – Representative
• Stable • 3-5 measures that… Are collected in appropriate setting(s) Are collected within a relatively short time e.g. 3 CBM 1 min. reading probes Representative Teacher says are “typical” and…… Accurately describes the behavior as it naturally occurs Data should be……..
Step 2: Summarize the Data • Use a median score (Median = middle) • 16,22,23……………………..median = 22 • 114, 136,140………………..median = 136 • 100, 107, 107……………….median = 107 • 32, 32, 32……………………median = 32 • 20, 24, 30, 31……………….median = 27 • 65, 72, 80……………………median =______ • 48, 61, 62……………………median =______
Step 3: Select a Performance Standard • A performance standard is a yardstick to measure baseline data / Examples: • AIMSweb CBM norms • Peer performance • Instructional placement standards • School policy/standards • Developmental norms • Adult expectations (parents, teachers)
Step 4: Evaluate Data • Does a discrepancy exist between the individual’s performance and the chosen standard? – No = STOP – Yes = answer next questions • Is the discrepancy large enough for you to implement an intervention to reduce it? – No = STOP – Yes = DO SOMETHING!
Example: Sandy’s PLOP 1. Collect the baseline data: • Mrs. Henry will use 3 grade level reading probes to assess Sandy’s oral reading fluency. • Results: 7, 14, 12 2. Summarize baseline data: • Find median level of performance • Median = 12 3. Select a performance standard • Class median performance is 112 words per minute 4. Evaluate baseline data • Is there a discrepancy? • Yes….12 wpm vs. 112 wpm • Large enough to warrant intervention? • Yes..100 wpm
Writing a PLOP Statement • Include: – Description of the strengths relevant to the presenting problem – Description of the problem academic, nonacademic, and/or transition areas – The baseline performance: • The performance standard selected/applied • General statement of the expectation for change • Other information relevant to the presenting problem
PLOP Statement: Sandy • Sandy enjoys reading, however, she currently reads third grade passages at a rate of 12 WPM. To be at grade level, Sandy is expected to read 112 WPM, which is at the 50th percentile.
D – Component: Problem Analysis • Problem analysis is the process used to examine probable explanations for the discrepancy between what the individual is expected to do and what the individual is doing. • Why a discrepancy????
Problem Analysis is: • Data based • Question oriented • Multi-dimensional • Focused • Collaborative • Based on sound procedures • Leads to an intervention • In fact……..if done well………an intervention usually falls into your lap!
Step 1: Clarify problem asskill or performance • Example: Jeremy has a reading problem: – Jeremy’s median score for retelling details is 2. Peers retell a median of 5 details. • Skill – Needs additional instruction, practice & feedback – Early acquisition of a skill • Performance – Can retell details – Doesn’t care if retells details – Topic is uninteresting to him – Thinks it is stupid – Errors are not attended to
Step 2: Reconsider the 4 ICEL Domains • Learner • Instruction • Curriculum • Environment
Step 3: Organize and reviewexisting information • Why is this problem situation occurring? • What factors are contributing to the mismatch that exists between actual and desired levels of performance for each problem? • What resources are available to help resolve this problem situation?
Step 4: Examine probable explanationsfor the discrepancy and possible solution • Apply this format: • Problem analysis shows that if___________________________ is the problem, (behavior) then __________________________ will/should (intervention) ________________________________________ (effect/outcome/results upon “problem”)
E- Explore Intervention Options • Components: • 1. Write a goal • 2. Brainstorm interventions
Exploring Interventions • After defining the problem the team must brainstorm intervention solutions having the best probability of success. • To do so, the team first writes a measurable goal consistent with previous decision-making • Prioritizes interventions/accommodations to be implemented, and makes a decision • Summarizes what they are going to do
The goal is the intended outcome of the intervention; the direction and extent to which the target behavior is to be changed. It takes into account a student’s present level of performance (PLOP) Precedes & defines the system of monitoring progress “What is the Goal?”
A Goal Statement Should Include: • Student’s Name • Conditions – time frame, situation/setting, materials used – measurement materials • Behavior – description of the task to be performed, what the student is expected to do • Criterion - represents a criterion for acceptable performance/behavior (CAP)
Academic Date by or timeline in which goal is to be achieved Description of the material(s) to be used Description of difficulty level Non-Academic Date by or timeline in which goal is to be achieved Setting in which behavior is to be displayed Stimuli to elicit behavior Conditions Example: In 9 weeks using 3rd grade CBM Math probes……
Behavior/Performance • Behavior performance is the description of the task to be performed • It may be the targeted behavior OR • It may be the replacement behavior Example: will score 35 correct digits per minute
General Characteristics ofAcceptable Goals…… Are SMART • Specific • Measurable • Ambitious • Realistic • Take into account the Gen. Ed. curriculum
Sandy’s Goal • Conditions (time frame, materials, setting) • Student’s Name • Behavior (what we expect) • Criterion (standard for expected performance) • Goal: In 9 school weeks, using 3rd grade CBM reading probes, Sandy will read orally at a median rate of 50 words correctly for 2 consecutive weeks.
Brainstorm Interventions Interventions are: – Linked to a GOAL: the behavior/performance will change relative to the goal set by the team. – Systematic/Well Planned: the procedures to be applied are specified clearly and completely – Environmentally Focused: the actions taken modify the environment, not only upon the student
Some Examples of Interventions: • Using Corrective Reading (SRA) • Modeling how to initiate peer interaction & allowing practice • Peer tutoring • Small group instruction • Using strategies for sentence writing • Teaching strategies for test taking • Providing positive reinforcement for corrective behavior
Interventions are not…….. • Accommodations • Adaptations • Interagency referrals • Special education settings • Assessments, evaluations, screenings • Classroom observations • Advice or consultations • Assisting with instructional methods and materials • Places
Defining differences in……… • Accommodations are supports or services provided to help a student access the general curriculum provided. • Adaptations are changes made to the content and performance expectations for students • Interventions require direct instruction and data collection for the area of concern
Identify the interventions…… • Student attends resource room for reading. • Student receives small group instruction on how to divide single digit problems. • Student works with a tutor/peer to practice multiplication tables. • Student is reinforced for sitting in her seat. • Student works in a small group (4 students) with Literacy Facilitator working on decoding skills.
Brainstorm • Record brainstorm ideas • Elicit ideas only • Discourage criticisms or questions (no judgment) • Push for between 6-8 ideas
Clarify • Ask if any ideas need to be clarified. • The author of the idea provides the clarification. • The facilitator observes the questioner during clarification and stops the clarification when questioner indicates nonverbally or otherwise that he/she understands.
Advocate • Participants may advocate for as many items as they wish and as many times as they wish. • Statements of advocacy must be phrased in the positive. • Statements of advocacy must be brief
Canvass • Ask RTI team members to identify which few (between 2-4) of the ideas they feel are most important. • The ideas they feel are the most important do not need to be placed in rank order. • Take a hand count (vote) to determine which ideas are of greatest interest to the group.