Download
1 / 6
60 likes | 227 Views
Advanced Algebra II Notes 1.4 Graphing Sequences. Turn to page 51 in your textbook. For each table, choose a recursive formula and a graph that represents the same sequence. 1. _________ _________ 2. _________ _________ 3. _________ _________ 4. _________ _________

E N D
Advanced Algebra II Notes 1.4 Graphing Sequences Turn to page 51 in your textbook. For each table, choose a recursive formula and a graph that represents the same sequence. • 1. _________ _________ • 2. _________ _________ • 3. _________ _________ • 4. _________ _________ • 5. _________ _________ • 6. _________ _________
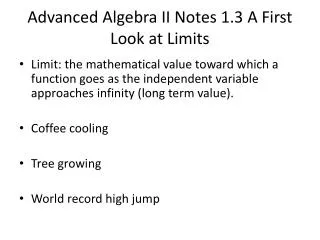
What generalizations can you make about arithmetic sequence graphs, geometric sequence graphs, the effect of positive or negative common differences, and the effect of r values between 0 and 1 and r values greater than 1?
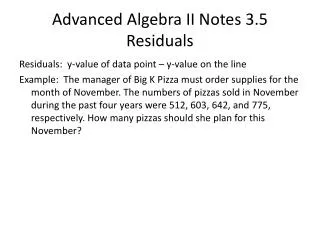
Example In deep water, divers find that their surroundings become darker the deeper they go. The data here give the percent of surface light intensity that remains at depth n ft. in a particular body of water.
Calculator Notes are available on www.keymath.com • 2nd y = ENTER • Enter on 1: PLOT 1 • Enter on ON • Down arrow to Type: enter on first (scatter plot) • X list: L1 • Y list: L2 • Go to Home Screen by pressing 2nd MODE • Press y = and clear out all equations • Press MODE and down arrow to FUNC PAR POL SEQ and right arrow to SEQ and ENTER • Press STAT • Enter on 1: Edit • Up arrow to L1 and press CLEAR, ENTER • Up arrow to L2 and press CLEAR, ENTER • Enter the depth values in List 1 and the Percent of light in List 2 (be sure that there are the same number of entries in each List) • Press ZOOM and down arrow to 9 (ZOOMSTAT) and ENTER • A graph of the points will appear • Press y = • Set nMin to be the n-value of the starting term: 0 in this case • Enter the equation for u(n) . To get u(n – 1) press 2nd 7 (which gives the letter u) (variable button, - 1) • See page 53 for directions and sample screens • WINDOW: nMin 0 nMax 100