Download
1 / 48
480 likes | 625 Views
Last Week. Celestial Co-ordinates Measurements of Distance to add to Surface Temperature and Mass Locally we can use Stellar parallax. To go to greater distances we need to use measurements of brightness. 1AU. Star. Stellar Parallax. Tan p = p =1AU / d 1 radian = 2.063 x 10 6 seconds

E N D
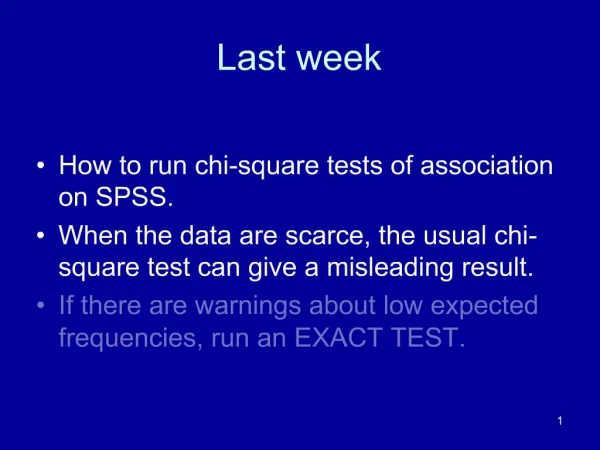
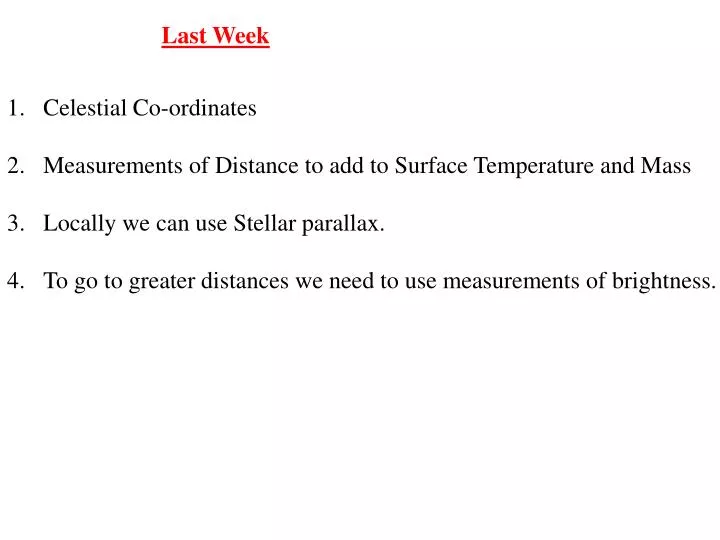
Last Week • Celestial Co-ordinates • Measurements of Distance to add to Surface Temperature and Mass • Locally we can use Stellar parallax. • To go to greater distances we need to use measurements of brightness.
1AU Star Stellar Parallax • Tan p = p =1AU / d • 1 radian = 2.063 x 10⁶ seconds • If we define 1 parsec = 2.063 x 10⁶ seconds – Unit of distance • d = 1/p where d is in parsecs and p is in arcseconds.
Parallax • From Earth we can only use this technique for about 10,000 stars. • HIPPARCOS (High Precision Parallax Collecting Satellite) • - was launched by ESA in 1989. • - measured parallax for 118,000 stars to 1-2 milliarcseconds to • an error of 10%. • - This is for all stars within several hundred parsecs. In other words • the method has been applied for stars out to about 100pc or 300 ly. • This sounds a large number but remember the numbers of stars in typical galaxies - 1011
Units of distance Astronomical Unit = Mean Earth-Sun distance = 149.6 million km. Light year = distance travelled in vacuum by light in 1 year. = 9.46 x 10¹² km = 63,240 AU Parsec = is the distance from which the Earth’s orbit subtends an angle of 1//. (1 arcsecond) 1 pc = 3.26 ly = 3.086 x 10¹⁶ m = 206,280 AU. Note:- kiloparsecs, Megaparsecs and gigaparsecs are all in use.
Distance and Brightness • Stellar parallax is a reasonably secure method of measuring distance but it is limited to a relatively small number of stars close to us. We need other methods of measuring distances to stars. Many of them • rely on measurements of brightness. We must now consider • brightness before we can look at other measures of distance Luminosity = power radiated by a star.
Stellar Brightness • Among the most basic observations are distance, brightness(luminosity), surface temperature, mass etc. • Luminosity- once we know the distance of a star we can determine the luminosity, a measure of the total power emitted by the star. Star radiates isotropically (reasonable assumption). The energy is spread evenly over the surface of a concentric spherical shell centred on the star. Now the surface of a sphere is 4R2 so the flux at any point on the concentric shell is inversely R2, the distance from the star. 2R • If a star’s apparent intensity, how bright it appears from the Earth, can be measured and its distance is known then its absolute intensity can be calculated.
Stellar Brightness • Stellar separations and intensities vary over many orders-of magnitude. As a result it is convenient to use logarithmic scales. • Astronomers use relative measures of Intensity. The system is based on the assumption that iVEGA = 1.0 and the apparent intensities of all other stars (i) are measured relative to the intensity of Vega. We define the apparent magnitude (m) of a star as m = -2.5log10 i ----- definition. Here m is related to how bright the star appears in the night sky.
Brightness Historically Astronomers used the Magnitude Scale for Brightness. • 1ST magnitude appeared twice as bright as 2nd magnitude - Hipparchus could distinguish down to 6th magnitude. • This is the quantity m = apparent magnitude - This is how bright an object appears from Earth. - Note that m gets larger for objects that are fainter. • Note that 100 = (2.512)5 • We definem = -2.5log10 i and iVEGA = 1.0 • Real energy output of a star = Luminosity = Absolute Magnitude (M) • We relate m and M. They are equal at a distance of 10pc.
Stellar Brightness m = -2.5log10 i ----- definition Apparent Magnitude • Since iVEGA = 1.0 it has m = 0.0 There are a few stars brighter than Vega in the sky and they all have -ve apparent magnitudes. The brightest of all is Sirius at m = -1.5. An object ten times brighter than Vega has m = -2.5 • One peculiarity of this system is that dimmer stars have larger apparent magnitudes. Thus i = 0.1 has m = + 2.5 10 times dimmer than Vega i = 0.01 has m = +5.0 100 times dimmer than Vega Note:-Eye can detect stars to m = 6 or 7. [System due to Hipparchus.]
Stellar Brightness • Conversion to Absolute Magnitude( M ):- If we have an absolute intensity (I ) then i I i = C.I d2 where C is a constant of proportionality. So i d2 = C.I taking logarithms to base 10 and multiplying by -2.5 gives -2.5 log10 id2 = -2.5 log10CI -2.5 log10i -2.5log10d2 = -2.5log10C -2.5log10I If we then write M = -2.5log10I as for apparent magnitude then we can write m -5log10d = M - 2.5log10C To connect m and M we must decide on the constant term.
Stellar Brightness We do this with the following arbitarary definition:- M = m when the star is viewed from a distance d = 10 pc. Then M = m -5 log10d + 5 We now have a link between M,m and d where d is in parsecs. [Note: we have assumed that the inverse square law is the only reason for the dimming of the light from the star.It takes no account of any possible absorption in dust between us and the other star.] [Note: This not an SI system of units] How can we use this equation? Example:-From the Earth the Sun is 4.8 x 10¹⁰ times brighter than Vega. What is the Sun’s absolute magnitude given that Vega is 8.1 pc from Earth?
Example:-From the Earth the Sun is 4.8 x 10¹⁰ times brighter than Vega. What is the Sun’s absolute magnitude given that Vega is 8.1 pc from Earth? i = 1.0 for Vega and 4.8 x 10¹⁰ for the Sun - Apparent magnitudes mSUN = -2.5 log (4.8 x 10¹⁰ ) = -26.7 Now 1pc = 2.06 x 10⁵ AU so for Sun d = (1/ 2.06 x 10⁵) pc Therefore MSUN = mSUN -5log10(1/ 2.06 x 10⁵ ) + 5 = +4.9 What is the Absolute magnitude for Vega? MVEGA = mVEGA - 5log10dVEGA + 5 = 0 - 5log10( 8.1 ) + 5 = 0.5 Hence since M = -2.5 log10I and 0.5 = -2.5 log10IVEGA , 4.9 = -2.5 log10IS 4.9 - 0.5 = -2.5( log10ISUN - log10IVEGA ) So IVEGA = 10(4.9 - 0.5)/2.5.ISUN = 57 ISUN
Pogson’s Equation • iVEGA = 1.0 ------ definition • m = -2.5log10 i ----- definition. • M = -2.5log10I -----definition • M = m -5 log10d + 5 ----Pogson’s Equation • M = m when the star is viewed from a distance d = 10 pc These definitions are just something you have to accept This gives us a link between distance d in parsecs and the apparent (m) and absolute (M) magnitudes.
Stellar Sizes Absolute Magnitude(M) is a measure of the total power that is radiated by an object. From the star’s spectral type we obtain the surface Temperature T.This gives via the Stefan-Boltzmann Law P = .T4 the amount of radiation emitted per unit surface area. It is then a simple matter to obtain a measure of the size of a star from Surface area = Total Power/ P If we assume that the star is spherical then surface area is 4R2 and we can deduce the radius of the star. On this assumption R2 = Total Power/ 4P
Apparent Magnitude Parallax EM Spectrum T Distance Absolute Magnitude Energy emitted per unit area Total Energy emitted SIZE Assuming a geometry for the star.
Stellar Distances • We have already seen that the method of Parallax only works for nearby stars. We need other methods. • To go to much greater distances we need some other kind of yardstick . We introduce the idea of the Standard Candle = an object whose absolute intensity we assume we know. From the observed intensity, the apparent magnitude m, we can then deduce the distance d from M = m -5 log10d + 5
Cepheid Variables • Amongst the variable stars we find Cepheids, named after Cephei. The latter was discovered by a young man, John Goodricke, living in York, in 1784. Their use to measure distance derives from the work of Henrietta Leavitt (Harvard), who observed a correlation between brightness and the period of pulsation (P) for these stars. It is thought that all Main Sequence stars pass through this phase at some point in their life cycle. For Classical Cepheids M = -2.8 logP, where M = average absolute M. The range of absolute magnitudes for such stars is M = -1 to -7 and their periods vary from 2-100 days. The use of these stars as Standard Candles allows distances up to Mpc to be measured.
Cepheid Variables This shows the details of how Cephei varies with time. At the top the star’s magnitude varies with time in days.--The Light curve Then follows on the same time scale - the radial velocity - the star’s surface temperature - the star’s diameter. M = -2.8 logP allows measurements to about 20 Mpc
M Cepheid variables This shows the relationship between absolute magnitude and period of intensity variation for pop.1 And pop. 2 Cepheid variable stars. Population 1 And population 2 stars can be distinguished by their spectra.Type 1 are metal- rich and type 11 are metal-poor. In terms of measuring distance we can measure their period and then use this graph to determine M.A measure of m then gives d from M = m -5 log10d + 5 Metal-rich Metal-poor P
Example from “UNIVERSE”-Freedman and Kaufmann • Galaxy IC 4182 Hubble Space Telescope used to make 20 separate images of galaxy. They found 27 Cepheids in IC 4182. They were able to plot their light curves. One particular cepheid had P = 42 days and m = 22.0. From the spectrum they could tell it was metal-rich, population 1. They now used the graph of M versus P to find M = -6.5 M = m -5 log10d + 5 m-M = 28.5 We can rewrite our eqn as d = 10(m-M+5)/5 parsecs So for this case d = 5Mpc In 1937 there was a Type1a supernova in IC 4182 with m = +8.6 Since m-M = 28.5 for this galaxy we know M = -19.9 for the supernova. Type1a are exploding white dwarfs. They are thought to always have same M. Measurements like this calibrate them as Standard Candles.
Distance Measurements • It was Hubble’s observation of Cepheid variables in Andromeda which allowed him to determine how far away it is and establish it as another galaxy.The use of Cepheid variables is the first step in a chain of measurements of galactic distances. Beyond tens of Mpc we need brighter objects -brighter Standard Candles. • NOVAE These are thought to be close binary systems in which one component is a White Dwarf star.The other component is a giant star which has grown so large that the outer layers of H are dragged off by the grav. field of the White Dwarf.The H builds up on the surface and when there is sufficient material,sufficient pressure and temperature we get a thermonuclear explosion.This is a NOVA--a new star. Artist’s idea of R Acquarii-A nova seen in inset with the uncorrected HST
Novae • White Dwarf star is the remnant of stars up to about 8 solar masses • In essence it is the core of a star like the Sun that has shed its outer layers in a planetary nebula. A typical example of which we see below. Initially it is quite hot since it was the core of a star but slowly cools with time. Typically it has a radius 1% of the solar radius and T = 24,000 K Helix Nebula An example of a planetary nebula Sirius B is an example of a white dwarf
Novae • The White dwarf is small in radius but high in density. • It is maintained by electron degeneracy pressure • No White Dwarf can have a mass greater than 1.4 solar masses - the Chandrasekhar limit. Theory is backed by experiment. If isolated a white dwarf will simply cool with time since it has no source of fuel. It will become a cold, black dwarf. Its size will remain the same since the electron degeneracy pressure keeps it stable against gravitational pressure.
Novae • The situation is different if it is in a close binary system. • If its companion is a main sequence or Red giant star then it can gain mass from its companion. Clump of mass has some small angular velocity. Law of conservation of angular momentummeans it moves faster and faster as it falls in. The infalling matter forms an accretion disc – a whirlpool like disc of matter around the White Dwarf. This is a new source of energy for the star. The disc becomes hot because grav.P.E. has been turned into K.E. It can shine brightly with UV and X-rays.
Novae • More dramatic events can follow. • H from the companion gradually spirals in through the disc and falls on the surface. The strong gravitational field compresses this gas into a thin surface layer. Both pressure and temperature rise as the layer builds up. When T approaches 107 K hydrogen fusion erupts. The thermonuclear explosion causes the system to shine for a few glorious weeks. It generates heat, light and ejects most of the accreted mass. Accretion now resumes and the process is repeated. The time between novae depends on the mass of the White Dwarf. Period ranges from decades to 10,000 years.
Novae Theory cannot tell whether mass of the white dwarf increases or decreases with time. In some cases the mass approaches the limit of 1.4 solar masses. Its interior temperature rises high enough for carbon fusion to begin. It ignites almost simultaneously throughout the star and it explodes completely in what is called a white dwarf supernova or Type 1 supernova. The peak luminosity is about 1010 solar luminosity, which fades steadily. The spectrum has no H lines ((or almost none) since the White dwarf has very little H.
NOVAE The two stars orbit the c-of-m. As the Red Giant grows some of the H envelope goes beyond the c-of-m and it is attracted to the White Dwarf and accumulates there. With enough H the T and P is enough to restart nuclear reactions on the surface of the star.The rapid rise in the T causes a huge increase in intensity and material is thrown into space. This does not destroy the two stars and the process starts again.
NOVAE • Statistically we expect about 10-40 novae per year in the Milky Way but we only see about 2-3 because of the vast amounts of interstellar dust and gas within our galaxy. • Novae as Standard Candles--the absolute power output varies quite a lot but it turns out we can still use novae for this purpose.
Novae as Standard candles a) They are very bright-absolute power output rises 8-10 orders-of- magnitude. b) It then decays with a time ( = time to decline by 3 orders-of- magnitude.) There is a distinct relationship, determined empirically, between MV ,the peak absolute magnitude, and . MV = -2 + 2log If we measure m and obtain M from the above then we can use M = m -5 log10d + 5 to obtain d
NOVAE Why does the relationship hold? If you have a smaller, more massive white dwarf --greater compression of gas on the surface --greater heating of accreted gases on surface So a thermonuclear runaway is initiated with smaller accumulated mass The less massive surface layers are more readily ejected and so the nova declines more rapidly. Hence the relationship MV = -2 + 2log The brightest novae are about as luminous as the brightest Cepheids,so their use spans the same range of distance out to about 20 Mpc.
Stellar Distances • We can see Parallax, Cepheid variables and Novae as PRIMARY DISTANCE INDICATORS. • To measure greater distances we must use SECONDARY INDICATORS All such indicators must be calibrated by their observation in galaxies at known distances. In essence for each such method we try to make use of the brightest objects in a galaxy.
Next Secondary Indicator - Ionisation Nebula or HII region Remember we are always hunting for some class of objects where we believe we know the absolute magnitude M
Levels and Transitions in Hydrogen The figure shows the levels in the hydrogen atom. The zero of energy is at infinity. The levels are labelled by the Principal Quantum Number n and by the energy[on the left] The series of spectral lines that were found empirically by various experimenters are shown. Each series ends on a particular level. 656 nm
Stellar spectra-4 Here we see the atomic spectra for white light,sunlight and a series of elements. Note that the last spectra are for Na in emission and absorption. These spectra provide clear fingerprints for the chemical elements. 656 nm line in hydrogen
Stellar Distances – Secondary Indicators Orion Nebula –bright young stars at its heart. Lanes of dark dust. The pervasive glowing red hydrogen gas. Blue tinted dust reflects light from newborn stars.
Stellar Distances – Secondary Indicators Hot massive stars live fast and die young. As a result they do not move far from the clouds of gas and dust from which they form. We find them in star clusters in the clouds of molecular dust. Orion is a good example. The wispy clouds are ionisation Nebulae = HII regions The gas is irradiated by neighbouring hot stars. The H atoms are excited and ionised by the radiation. They emit light. In particular they emit The 656 nm line in the Balmer series [n = 3 n =2] The H appears red because of the copious emission of this line. Note the [n = 2 n = 1] line is also emitted but it is in the ultraviolet.
Stellar Distances – Secondary Indicators One possible standard candle is the average of the three strongest H11 regions in a galaxy. Such regions contain up to 109 solar masses of ionised H. Measurements of the angular sizes of the H11 regions and the apparent magnitude of the galaxy allows comparison with galaxies at known distances. However the regions are irregular. [use with caution]
Stellar Distances • Brightest Red Supergiants:-seem to have the same absolute magnitude in all galaxies,as concluded from careful studies by Roberta Humphreys It seems that mass loss pares the brightest Red Giants down to about the same maximum mass.Thus they have about the same luminosity. Sampling a number of galaxies,the average visual magnitude of the three brightest red stars was found to be MV = -8.0 • Because individual stars have to be resolved to use this method it has a slightly larger range than cepheids. Because they are brighter. we can see them out to 50Mly. • One problem with this method is that the limited sampling inherent in such methods can lead to errors.Clearly it is statistically more secure to take as large a number of objects as possible into our sample.
Globular Cluster M10 – 16,000 ly away in ORPHIUCUM Diameter is 70 ly Mainly post-Main sequence stars
Globular Clusters These spherical “clouds” of stars or clumps of stars contain typically thousands of stars in a relatively small volume. When we look at the Globular clusters in the Milky Way we find that they have a very large range in luminosity. They are bright or not depending on how many stars they have. We can draw the kind of graph we see here. Other galaxies give similar curves. . Curve for Virgo
Stellar Distances • Global Cluster Luminosity Function:- Statistically it is better to use a whole class of objects associated with a galaxy. One possibility is the use of Globular Clusters.The picture shows the variation in magn. for the globular clusters around four giant elliptical galaxies in the Virgo Cluster. The distribution is well-fitted by a Gaussian function with a turn-over magnitude at -6.5. This can be used as a Standard Candle [Can be used out to 150Mly]
Supernovae as Standard Candles • The brightest supernovae reach M = -19 at the peak of their output. In theory they can be seen up to 8000 Mly from Earth. This makes them potentially very interesting as Standard Candles. • Supernovae are divided into various types. Type 1 are thought to be formed by the same kind of event that causes novae. In this case however the White Dwarf collects so much material that it collapses under the mass of material. The result is a large explosion, ripping the star to pieces. • Type 1 can be subdivided and it is only type 1a which is useful because the others show irregularities in their light curves and spectra.they are also fainter and rarer. • Type 1a have a well defined peak magnitude because the mass limit for gravitational collapse is sharply defined [Chandrasekhar limit of about one solar mass].
Supernovae as Standard Candles and Rulers • Typically Type 1a reaches M = -19 with the rise occurring at 0.25-0.5 magnitudes per day. After approx. a week at maximum brightness the decline begins. Initially it declines at 1 magnitude per week but slows down to 1/10 weeks. • As well as providing a Standard Candle which can be used out to great distances it can also be used as a standard ruler. The explosion produces an expanding envelope of luminous gas which can be studied spectroscopically to give Doppler shifts.The angular expansion of the remnant can also be used to give the distance from r = d.2 r 2 d From the arc we can get its size.
Tully-Fisher Relationship • 1977-R.Brent Tully and J.Richard Fisher discovered a relationship between the Doppler broadening of the H 21 cm line and the luminosity of a spiral galaxy.This provides the basis of a method of measuring distances to spiral galaxies. If a spiral galaxy is rotating then it may have a velocity relative to us overall but the rotational motion of the galaxy means that the velocity at the two extremes is different.As a result when we look at the 21 cm line from this galaxy it will be broadened since the wavelength will be shifted by different amounts from the two extremes. • Tully and Fisher measured the width of the 21 cm line of neutral H in the radio spectrum for a set of spiral galaxies.Typically the line shows a double peak.
Tully-Fisher Relationship • Tully and Fisher showed that there is a correlation between a spiral galaxies luminosity and its maximum rotational velocity( and hence the spread in the line width). • Why does the relationship occur? The speed of rotation is,of course, related to its mass by Kepler’s Third Law P2 = 42. r3 M here is mass G.M i.e. larger M means smaller P. • The more massive the galaxy the more stars it contains and hence the brighter it is. That is large mass means larger Absolute magnitude. • Line widths can be measured very precisely so this relationship can be used to determine the luminosity of distant spiral galaxies.Combining this with measures of apparent brightness gives us the distance from M = m -5 log10d + 5
We now see that there are a variety of methods of determining stellar and galactic distances.The table shows the ranges they cover. • Parallax d = 1/p . Smallest p = 0.001arcseconds equivalent to 3kly • Cepheid variables M -6 so Max. d 20Mly or 30 Mly with HST • Novae – depends on mass but we can use them out to 20-30Mly • Red Supergiants M -8 so Max. d 50Mly • Blue Supergiants M -9 so Max. d 80Mly • Beyond 80Mly we can no longer distinguish individual stars. • Brightest globular clusters M -10 so Max. d 130Mly • Brightest HII regions M -12 so Max. d 300Mly • Tully-Fisher relationship ~ 300 Mly or so. • Type 1A Supernovae M -19 so Max. d 8000Mly