Download
1 / 16
160 likes | 279 Views
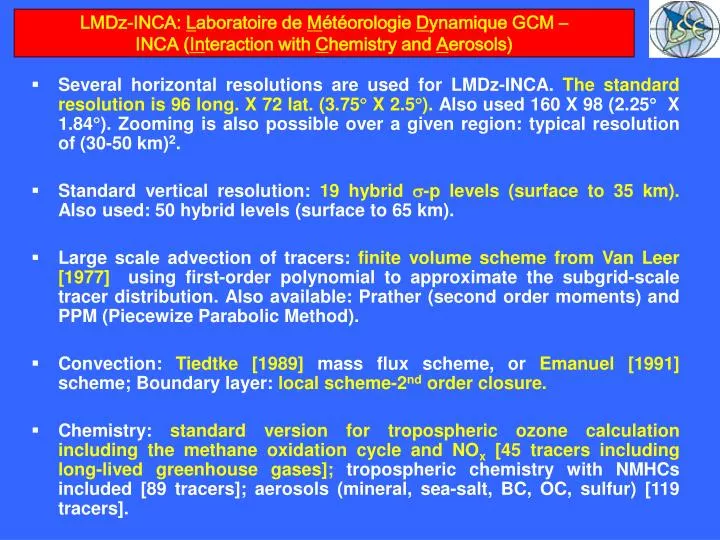
LMDz-INCA: L aboratoire de M étéorologie D ynamique GCM – INCA ( In teraction with C hemistry and A erosols).

E N D
LMDz-INCA: Laboratoire de Météorologie Dynamique GCM – INCA (Interaction with Chemistry and Aerosols) • Several horizontal resolutions are used for LMDz-INCA.The standard resolution is 96 long. X 72 lat. (3.75 X 2.5).Also used 160 X 98 (2.25 X 1.84). Zooming is also possible over a given region: typical resolution of (30-50 km)2. • Standard vertical resolution:19 hybrid -p levels (surface to 35 km).Also used: 50 hybrid levels (surface to 65 km). • Large scale advection of tracers:finite volume scheme from Van Leer [1977]using first-order polynomial to approximate the subgrid-scale tracer distribution. Also available: Prather (second order moments) and PPM (Piecewize Parabolic Method). • Convection:Tiedtke [1989]mass flux scheme, or Emanuel [1991] scheme; Boundary layer:local scheme-2nd order closure. • Chemistry:standard version for tropospheric ozone calculation including the methane oxidation cycle and NOx [45 tracers including long-lived greenhouse gases];tropospheric chemistry with NMHCs included [89 tracers]; aerosols (mineral, sea-salt, BC, OC, sulfur) [119 tracers].
Implementation of emissions • Non-transport anthropogenic emissions: EDGAR 3.2 Fast Track 2000 • CH4, NOx, SO2, CO and NMHCs • implementation of effective emission heights on RETRO levels (1 km) • Transport emissions: land-based transport: QUANTIFY emissions for road (DLR) EDGAR emissions for rail ship emissions: QUANTIFY emissions (DNV) aircraft emissions: AERO2K emissions (MMU - UCAM) • Biogenic emissions provided by the vegetation model ORCHIDEE
Introduction of new tracers • 6 artificial tracers: tracers with lifetimes of 1, 10 and 30 days emitted at land or sea surface 3 tracers for 14CO: global, stratosphere and troposphere 8 tracers for O3: explicit calculation: troposphere over North America, Europe and Asia, and Stratosphere • implicit calculation: from ground to 300 mb over North • America, Europe and Asia, and Stratosphere • Basic approach proposed by Volker Grewe:
case with aircraft emissions reduced by 5% Vs reference case (January 2003, convection: Emanuel scheme) O3 (ppbv) NOx (ppbv) O3 (%) For a reduction of 100% max: ~ 1.45 ppbv max: ~ 40 pptv max: ~ 1.9 %
case with aircraft emissions reduced by 5% Vs reference case (April 2003, convection: Emanuel scheme) O3 (ppbv) NOx (ppbv) O3 (%) For a reduction of 100% max: ~ 1.8 ppbv max: ~ 50 pptv max: ~ 1.9 %
case with aircraft emissions reduced by 5% Vs reference case (July 2003, convection: Emanuel scheme) O3 (ppbv) NOx (ppbv) O3 (%) For a reduction of 100% max: ~ 1.5 ppbv max: ~ 25 pptv max: ~ 1.6 %
case with aircraft emissions reduced by 5% Vs reference case (January 2003, convection: Tiedtke scheme) O3 (ppbv) NOx (ppbv) O3 (%) For a reduction of 100% max: ~ 2 ppbv max: ~ 30 pptv max: ~ 2.6 %
case with aircraft emissions reduced by 5% Vs reference case (April 2003, convection: Tiedtke scheme) O3 (ppbv) NOx (ppbv) O3 (%) For a reduction of 100% max: ~ 2.3 ppbv max: ~ 35 pptv max: ~ 2.2 %
case with aircraft emissions reduced by 5% Vs reference case (July 2003, convection: Tiedtke scheme) O3 (ppbv) NOx (ppbv) O3 (%) For a reduction of 100% max: ~ 2 ppbv max: ~ 15 pptv max: ~ 2.4 %
case with road emissions reduced by 5% Vs reference case (convection: Emanuel scheme) January 2003 NOx (ppbv) July 2003 NOx (ppbv) For a reduction of 100% max: ~ 6.28 ppbv max: ~ 4.22 ppbv
case with road emissions reduced by 5% Vs reference case (convection: Emanuel scheme) January 2003 O3 (ppbv) July 2003 O3 (ppbv) For a reduction of 100% Max decrease: ~ 5.94 ppbv Max increase: ~ 2.24 ppbv Max decrease: ~ 3.72 ppbv Max increase: ~ 5.46 ppbv
case with road emissions reduced by 5% Vs reference case (convection: Emanuel scheme) January 2003 O3 (%) July 2003 O3 (%) For a reduction of 100% Max decrease: ~ 13.88 % Max increase: ~ 6.28 % Max decrease: ~ 9.64 % Max increase: ~ 44.58 %
case with ship emissions reduced by 5% Vs reference case (convection: Emanuel scheme) January 2003 NOx (ppbv) July 2003 NOx (ppbv) For a reduction of 100% max: ~ 3.24 ppbv max: ~ 3.72 ppbv
case with ship emissions reduced by 5% Vs reference case (convection: Emanuel scheme) January 2003 O3 (ppbv) July 2003 O3 (ppbv) For a reduction of 100% Max decrease: ~ 4.56 ppbv Max increase: ~ 3.12 ppbv Max decrease: ~ 2.64 ppbv Max increase: ~ 2.86 ppbv
case with ship emissions reduced by 5% Vs reference case (convection: Emanuel scheme) January 2003 O3 (%) July 2003 O3 (%) For a reduction of 100% Max decrease: ~ 19.64 % Max increase: ~ 7.7 % Max decrease: ~ 16.52 % Max increase: ~ 18.78 %
Conclusions • Small impact of aircraft emissions on tropospheric ozone and weak seasonal variability of the perturbation fields. need for further investigations. • The choice of the convection scheme is relatively important. • Large and comparable impact of road and ship emissions on tropospheric ozone at surface. Perpectives • Improvements of some chemical and physical representations in LMDz-INCA: water vapour, convective flux… the run with all traffic emissions reduced by 5% will not be performed • Re-run of these 5 base runs.