Download
1 / 24
240 likes | 339 Views
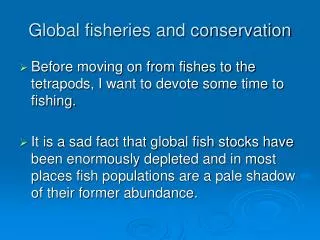
Global prioritization for conservation. Protected Area Planning and Management Mobile Seminar. Miguel A. Morales Conservación Internacional (CI). Costa Rica June 2008. from 1.65 billon a 6 billon people in the 20 th Century. 7,000,000,000. 6,000,000,000. 5,000,000,000. 4,000,000,000.

E N D
Global prioritization for conservation Protected Area Planning and Management Mobile Seminar Miguel A. MoralesConservación Internacional (CI) Costa RicaJune 2008
from 1.65 billon a 6 billon people in the 20th Century 7,000,000,000 6,000,000,000 5,000,000,000 4,000,000,000 3,000,000,000 2,000,000,000 1,000,000,000 0 0 500 1000 1500 2000 year Global biodiversity status poblacion
Larger population = Greater demand for resources Source: Millennium Ecosystem Assessment (2005)
Current species extinction rate 100 – 1000 higher than the “normal” rate Since 1.500, about 800 species has gone extinct, according to the IUCN Species Red List
Currently, about 16.118 species of plants and animals are threatened • One of 8 bird species • One of 4 mammal species • One of 3 amphibian species Source: The 2004 IUCN Red List of Threatened Species (www.iucnredlist.org)
Amphibian richness Global Amphibian Assessment, 2006
Terrestrial ecoregions within 14 biomes and 8 biogeographic regions Olson et. al. BioScience • November 2001 / Vol. 51 No. 11
867 distinctive ecoregions Olson et. al. BioScience • November 2001 / Vol. 51 No. 11
WWF Global 200 Mammal species richness Olson et. al. BioScience • November 2001 / Vol. 51 No. 11
WWF Global 200 Mammal species endemism Olson et. al. BioScience • November 2001 / Vol. 51 No. 11
WWF Global 200 WWF identified ecoregions with exceptional levels of species richness and high levels of endemism
CI Biodiversity Hotspots • High endemism and high threat (>86% original cover is lost) • 34 Hotspots representing 2.3% of earth’s land • 50% of all plants and 42% of vertebrate species live in these Hotspots • 75% of the most endangered species in the world (mammals, birds, and amphibians) Mittermeier et al. (2004) Hotspots Revisited. CEMEX
CI High-Biodiversity Wilderness Areas • High endemism (>1,500 species and plants are endemic) • Low threat (<30% original cover lost) • 5 HBWAs, covering 6.1% of earth’s surface • 17% of plants, 8% of terrestrial mammals only found here Mittermeier et al. (2004) Hotspots Revisited. CEMEX
WSC Human Footprint Sanderson et al. - BioScience - October 2002 / Vol. 52 No. 10
WSC The Last of the Wild Sanderson et al. - BioScience - October 2002 / Vol. 52 No. 10
UNEP/World Conservation Monitoring Centre Megadiverse countries 1. Australia 2. Brasil 3. China 4. Colombia 5. Republica Democrática del Congo 6. Ecuador 7. India 8. Indonesia 9. Madagascar 10. Malasia 11. México 12. Papua New Guinea 13. Perú 14. Filipinas 15. Sudáfrica 16. USA 17. Venezuela Fotos obtenidas del Internet
Smithsonian Institute (SI) Centers of plant diversity in the America http://www.nmnh.si.edu/botany/projects/cpd/index.htm