Download
1 / 3
70 likes | 204 Views
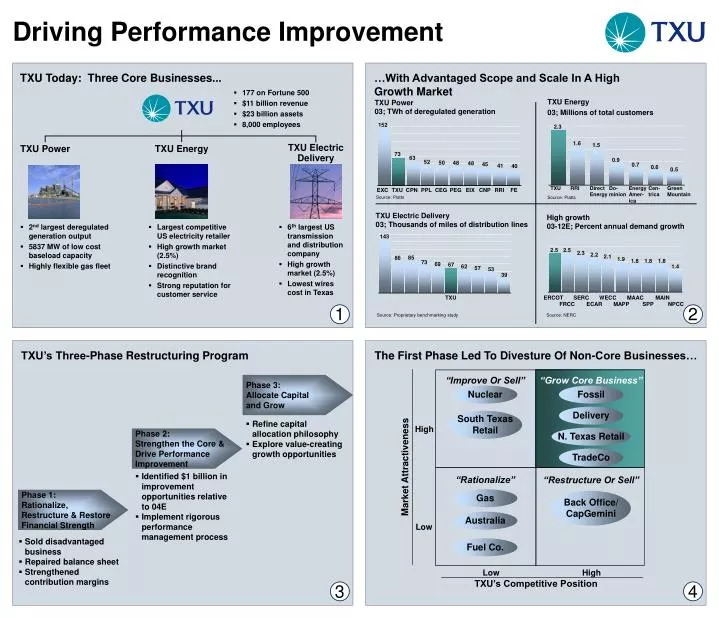
The First Phase Led To Divesture Of Non-Core Businesses…. “Improve Or Sell”. “Grow Core Business”. Nuclear. Fossil. Delivery. South Texas Retail. TXU Today: Three Core Businesses. …With Advantaged Scope and Scale In A High Growth Market. High. N. Texas Retail. 177 on Fortune 500

E N D
The First Phase Led To Divesture Of Non-Core Businesses… • “Improve Or Sell” • “Grow Core Business” Nuclear Fossil Delivery South Texas Retail TXU Today: Three Core Businesses... …With Advantaged Scope and Scale In A HighGrowth Market • High N. Texas Retail • 177 on Fortune 500 • $11 billion revenue • $23 billion assets • 8,000 employees TXU Power 03; TWh of deregulated generation • TXU Energy • 03; Millions of total customers TradeCo • Market Attractiveness • 152 2.3 • “Rationalize” • “Restructure Or Sell” 1.6 1.5 TXU Power TXU Energy TXU Electric Delivery Gas Back Office/ CapGemini • 73 • 63 0.9 • 52 • 50 • 48 • 48 • 45 0.7 • 41 • 40 0.6 0.5 • Low Australia TXU RRI Direct Energy Do- minion Energy Amer-ica Cen-trica Green Mountain EXC TXU CPN PPL CEG PEG EIX CNP RRI FE Source: Platts Source: Platts Fuel Co. TXU Electric Delivery 03; Thousands of miles of distribution lines High growth 03-12E; Percent annual demand growth • 2nd largest deregulated generation output • 5837 MW of low cost baseload capacity • Highly flexible gas fleet • Largest competitive US electricity retailer • High growth market (2.5%) • Distinctive brand recognition • Strong reputation for customer service • Low • High 143 • TXU’s Competitive Position 2.5 2.5 2.3 2.2 2.1 85 86 1.9 1.8 1.8 1.8 73 69 67 62 1.4 57 53 39 TXU ERCOT SERC WECC MAAC MAIN FRCC ECAR MAPP SPP NPCC 1 2 Source: Proprietary benchmarking study Source: NERC TXU’s Three-Phase Restructuring Program Phase 3: Allocate Capitaland Grow • Refine capital allocation philosophy • Explore value-creating growth opportunities Phase 2: Strengthen the Core & Drive Performance Improvement • Identified $1 billion in improvement opportunities relative to 04E • Implement rigorous performance management process Phase 1: Rationalize, Restructure & Restore Financial Strength • Sold disadvantaged business • Repaired balance sheet • Strengthened contribution margins 3 4 Driving Performance Improvement • 6th largest US transmissionand distribution company • High growthmarket (2.5%) • Lowest wirescost in Texas
- • - 5 6 ...Improving EPS… • EBIT • 03-05; $ millions 81% • 2,840 • 1,958 • 1,566 • Operational earnings 1 • 03-05; $ millions 154% • 05 • 04 • 03 • 1,381 • Interest • 03-05; $ millions • 861 4% • 544 • EPS • 03-05; $ per share 264% • 03 • 05 • 04 • 748 • 720 • 671 • ÷ • 5.65-5.85 • 2.65-2.70 • 04 • 03 • 05 • 1.58 • 032 • 05 • 04 • Shares outstanding • 03-05; millions • Taxes • 03-05; $ millions 185% 37% • 379 • 319 • 717 • 240 • 438 • 252 • 04 • 03 • 05 7 8 • 03 • 04 • 05 1 Includes impact from preferred dividends and excludes extraordinary items, changes in accounting principles and special items 2 Includes $0.15 per share dilution adjustment Driving Performance Improvement ...Deploying Proceeds To Improve Financial Flexibility TXU Is Driving Performance Improvement Across All Four Strategic Programs… EBIT improvement vs 0405-07; $ millions Phase 1: Uses of cash 04E; $ billions Phase 1: Sources of cash 04E; $ billions 14.2 14.2 Investments 1.0 1.0 Cash Balances Disc Ops & other 0.3 Securitization 0.8 Dividend 0.3 Equity repurchase 5.12 4.7 Borrowings 1.2 Cash from Ops Communications 0.5 0.5 TUFCO Gas Debt repurchase 1.9 7.61 3.6 Australia 1Includes $1.8B debt assumed by acquirer 2 Includes $1.1B equity portion of EPMI repurchase …Much Of Which Is Already Captured In The 04 Run Rate… 72% of earnings are already captured in the 2nd half 04 run rate
03 • 03 • 03 • 03 • 03 • 03 • 04E • 04E • 04E • 04E • 04E • 04E • 05E • 05E • 05E • 05E • 05E • 05E Equity Holders 9 10 Operational EPS growth07+; Percent Share re-purchases Growth capital Market growth Pro-ductivity gains Heat rate recovery Gas price declines Retail churn Annual EPS growth Assumptions: • $500-$750 million annually • $300- $400 million annually • 10% return • 2% annual De-livery revenue growth • 2% annual improve-ment in O&M and SG&A • 200 Btu/kWh annual heat rate improvement • $0.40/ MMBtu decline • 4% churn • 25% gross margin 11 12 Driving Performance Improvement Based On Our Disciplined Capital Allocation Process… ...Reshaping TXU’s Financial Profile • Operational EPS03-05; $ Per Share • Free cash flow103-05; $ Millions • ROIC103-05; Percent Retained ForInvestment • 1,600 • 5.65-5.85 • 13.8 264% 176% 91% • 10.2 • 836 • 2.65-2.70 “Customer” Capital Reinvest -ment Debt Reduction Dividend Payout Excess Excess Excess Excess • 5.0 Oper/ Divest Cash Flow • 1.58 TXU Business Units • 90 Yes Yes, if Yes, until Yes Repurchases or Distributions • Quality service • Production reliability • 50% of cash returned within 3 years • Minimum ROI of 15% Top Quartile Credit Metrics • Debt/EV1 • Coverage ratio • Debt/EBITDA • Payout of 30-40% • Total debt103-05; $ Billions • Total debt/EBITDA103-05; Percent • EBITDA/interest1 • 03-05; Ratio • 4.8 75% Total Payout Cap • 4.1 • 12.1 • 11.6 • 11.6 • 5.3 4% 40% 60% • 3.0 • 4.3 Debt Holders • 3.2 1 Adjusted for unusual tax of approximately $600 million in 03 (one time refund associated with Europe) and estimated one time tax expense of up to $500-$600 million in 05 (associated with portfolio restructuring transactions) 1 Enterprise value (EV) defined as market value of equity + total debt …Our Plan Will Result In Solid Earnings Growth Both In The Short Term… …As Well As In The Long Run Operational EPS growth05E-06E; Percent Hedge roll off Avoided dual nuclear outage • Productivity improvements • SG&A • O&M Cash deployment1 Delivery market growth Increased coal generation Customer churn 05E -06E growth range 1 Includes share buyback, investment, debt pay down