Download
1 / 18
180 likes | 287 Views
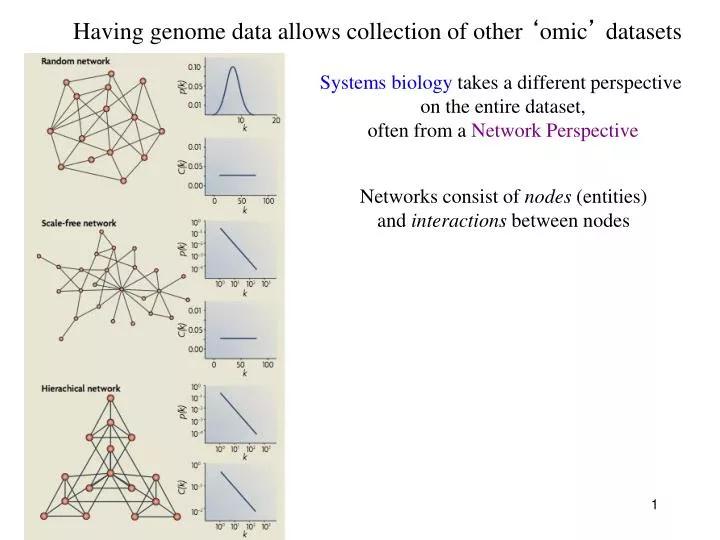
Having genome data allows collection of other ‘ omic ’ datasets. Systems biology takes a different perspective on the entire dataset, often from a Network Perspective. Networks consist of nodes (entities) and interactions between nodes.

E N D
Having genome data allows collection of other ‘omic’ datasets Systems biology takes a different perspective on the entire dataset, often from a Network Perspective Networks consist of nodes (entities) and interactions between nodes
Having genome data allows collection of other ‘omic’ datasets Systems biology takes a different perspective on the entire dataset, often from a Network Perspective Ongoing questions in Systems Biology: Types of network structures and their properties Effects of positive/negative feedback, feed-forward Dynamics of signal processing through network Insulation of signal through the network Ultimately, using information to predict output of the network given some input
Certain network features are of interest Node: entity (protein, gene, metabolite) Edge: connection (physical, genetic) between entities DAG: Directed Acyclic Graph Connectivity (degree):Number of connections Centrality (betweenness):How central a node is Assortativity: Density of a node neighborhood Distance: shortest path between 2 nodes Average Distance: average between all node pairs
Protein-protein interaction (ppi) networks Goal is to capture every ppi in the cell Data can be collected in several ways: Large-scale yeast two-hybrid assays (in vivo in yeast) Fuse bait to DNA binding domain of TF Co-express in yeast: library of proteins fused to activation domain of TF Reporter (often drug resistance gene) only expressed if BD and AD are brought together through ppi
Protein-protein interaction (ppi) networks Goal is to capture every ppi in the cell Data can be collected in several ways: Bait immunoprecipitation + tandem mass spectrometry (MS/MS) high throughput bait pull downs and tons of MS/MS
Protein-protein interaction (ppi) networks Goal is to capture every ppi in the cell Data can be collected in several ways: Bait immunoprecipitation + tandem mass spectrometry (MS/MS) high throughput bait pull downs and tons of MS/MS From Ho et al. Nature 2002 arrow indicates bait to target blue = previously known, red = novel this study
Protein-protein interaction (ppi) networks Goal is to capture every ppi in the cell Currently, there are several major issues with ppi * Only partial data: False Negatives (missed interactions) some interactions hard to measure * Often noisy: False positives (incorrect interactions) different types of noise inherent to different approaches * Affected (sometimes) by high false-positive interactions * So far mostly collected under standard growth conditions likely to be many condition-specific interactions & ‘rewiring’ • Still relatively low overlap between different ppi datasets • Most reliable data: that observed in >1 study
How do networks evolve? • Evolution of networks through: • * Adding new nodes to an network • * Addition/loss of connections • * Higher-order rewiring
Conservation of ppi’s across species ‘interlogs’ (M. Vidal): conserved protein-protein interaction pair Matthews et al. Gen Res 2001. Tested Y2H interactions in worm ‘interlogs’ - only 25% of previously shown Y2H ppi could be verified in yeast! - 6/19 (31%) were conserved ppi - another assessment found 19% of ppi were conserved so, 19 - 31% of ppi were conserved between yeast and C. elegans Other methods emerging to compare networks in a more complex way … but it’s challenging due to partial/noisy networks.
Do ppi’s constrain protein evolution? Fraser et al. Science 2001: significant correlation between rate of protein evolution and connectivity (# ppi) reported slower evolution rates for proteins with lots of contacts But other studies reported no significant correlation … Bloom & Adami. BMC Evo Biol. 2003: Reason for Fraser correlation was an artifact of some of the datasets - compiled 7 different yeast largescale datasets - argue that affinity purification = more artifactual ppi’s measured, specifically for abundant proteins - after controlling for this, the remaining partial correlation explained by protein abundance.
Genetic interaction networks Synthetic genetic (epistatic) interactions for double-gene knock outs: Negative interaction: double knockout phenotype worse than singles Gene 1 knock-out: no phenotype Gene 2 knock-out: no phenotype Gene 1 & 2 knocked out: sickly Positive interaction: double knockout phenotype improves over singles Gene 1 knock-out: sickly Gene 2 knock-out: no phenotype or sickly Gene 1 & 2 knocked out: less sickly Generally more (>2X in yeast) negative than positive interactions detected in a single species
Nat Gen 2008 Identified synthetic lethal (extreme negative) genetic interactions in S. cerevisiae Then used RNAi to knock down 837 pairs of orthologs in C. elegans Only 6 (0.7%) of pairs were synthetic lethal in C. elegans Adjust to ~5% given error rate not explained by paralogy, as these are all 1:1 orthologs Compared to >60% essentiality conserved across species (individual essential genes) >30% protein-protein interactions conserved across species
Science 2008 Nevan Krogan E-maps (epistatic interactions between pairs of gene xo’s) 550 genes, 118,000 different gene-gene knockouts, focusing on chromatin/nuclear * Matches a similar network designed in S. cerevisiae 15 - 30% of negative interactions were conserved between species (>500 my) more than C. elegans-yeast comparison by Tischler et al. >50% of positive interactions were conserved
Much higher conservation of genetic interactions if only look at interacting proteins
Several networks appear to have evolved significantly Sz. pombe -specific paralog of SWR-C RPD3L MED. MSC1 Roguev et al. 2008 WHY? 1. Could be subfunctionalization in Sz. pombe by SWR-C paralog MSC1 2. Could be compensation in S. cerevevisiae for loss of RNAi 3. Could be missed interactions (different environment, etc)
Many remaining questions … * What types of protein-protein interactions are most conserved and why? * What types of networks are more constrained and why? specific functions, structures, features more constrained? * What processes allow/promote network ‘rewiring’? * What effect do network interactions have on protein evolution rates? * How to ppi networks vary across environmental space and time?
Can also look at evolution of protein modification: phophorylation, acetylation, ubiquitination, glycosylation, etc Kinase ATP P Protein target IMAC: metal affinity purification: recovers phospho-peptides
Can also look at evolution of protein modification: phophorylation, acetylation, ubiquitination, glycosylation, etc Acetyl Protein target Immunoprecipitation to recovery modified proteins