Download
1 / 28
280 likes | 365 Views
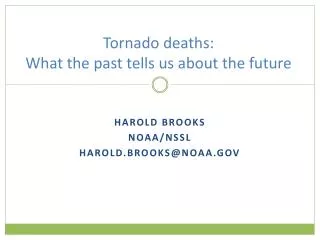
Tornado deaths: What the past tells us about the future. Harold Brooks NOAA/NSSL Harold.brooks@noaa.gov. General History of Death. >20000 people have died in US tornadoes (~400 years) Deadliest decade-1920s (95 min, 4 years>200, 3169 total) 1986-1995: 419 deaths 2000-2009: 558 deaths

E N D
Tornado deaths: What the past tells us about the future Harold Brooks NOAA/NSSL Harold.brooks@noaa.gov
General History of Death • >20000 people have died in US tornadoes (~400 years) • Deadliest decade-1920s (95 min, 4 years>200, 3169 total) • 1986-1995: 419 deaths • 2000-2009: 558 deaths • Only 3 years since 1974 > 100, max is 130 (1998)
10 Years of Tornado Fatalities by County Avg. Fatalities ~2.5 Avg. Injuries ~21 Avg. Prop. Dmg. ~$18M Avg. Track ~18 miles Avg. Width ~500 yards Avg. Rating ~(E)F2.5 631 Total Fatalities 1999-2008
What happened in 1925? • Seminal weather events that changed society • 1888 Blizzard • 1900 Galveston Hurricane • 1927 Mississippi River flood • 1930s Dust Bowl • 1925 Tri-State tornado
Mobile Home Permanent Home
Brooks and Doswell (2001) Highlight role of education in reducing 3 May 1999 deaths Question whether downward trend (post-1925) stopped Model death rate as function of mobile home fraction
Model Tornado Deaths (Brooks and Doswell 2001) Mobile home contribution to overall death rate
Mobile Home Permanent Home
Warning/response system • Warning • Decision • Dissemination • Reception • Response • Preparation • Options • Action
Warning performance • Lead time? • Lead time for warned tornadoes hasn’t changed in 25 years
Warning performance • Lead time? • Lead time for warned tornadoes hasn’t changed in 25 years • POD has increased • Sutter and Simmons-decrease in fatalities up to 15 minutes • Hoekstra • Preferred mean lead time 34 minutes • Given 1 hour lead time, respondents less likely to act immediately, more likely to flee • Stalker-Long lead-people prepared to take action • False alarms? • Many convolved factors (SE primarily) • What do people think is a warning for them?
What are the issues? • Organization of storms (warning challenges) • Ashley (2007) summarizes many aspects • Mobile homes • Nocturnal/visibility • Poverty • Preparation/response
Nocturnal Tornado Death Fraction Mobile Home Fraction by County Forest Cover Fraction in Poverty (Ashley 2007)
Compare to lightning • Which kills more in US?
Compare to lightning • Which kills more in US? • 1976-90: Lightning (m=90), tornado (53), lightning more in 13 years • 1996-2010: Lightning (41), tornado (63), lightning more in 3 years • Lightning deaths dropped dramatically starting ~1990 • Education-“30-30 rule” • Training-ER docs less likely to kill you now than 25 years ago
Final thoughts • Reducing deaths won’t come by improving forecast quality (lead time, POD, FAR) • Non-meteorological problem • Education/preparation • Choices for appropriate action • Communication of messages